Figure 6.

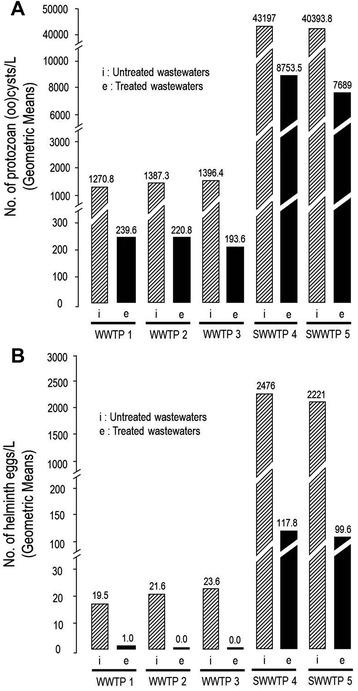
Geometric mean concentrations of protozoan (oo)cysts (A) , and helminth eggs (B) per liter of raw and treated wastewater samples from urban (WWTPs) and domestic wastewater tratment plants (SWWTPs).

Geometric mean concentrations of protozoan (oo)cysts (A) , and helminth eggs (B) per liter of raw and treated wastewater samples from urban (WWTPs) and domestic wastewater tratment plants (SWWTPs).