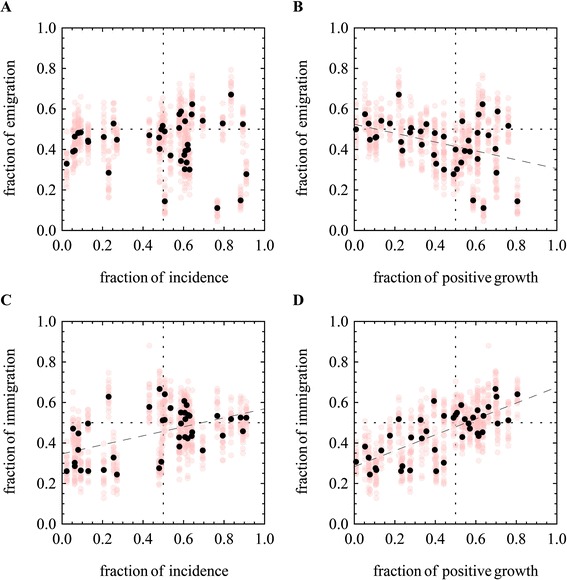
Figure 5.

Correlation between Growth, Incidence, Immigration and Emigration. Seasonal incidence profiles (Figure 3B) in each community, are used to identify gross periods of growth, decline, and to estimate the monthly % of the yearly incidence during six month periods, averaged across multiple years. Alternative seasonal migration models, partitioning the year into two, and centered on consecutive months (Jan-May) were parameterized using the MCMC. The number of stochastically mapped migration events between each pair of locations was counted in each of the six month long partitions. (A) Medians (black) and samples (gray) of the fraction of the total emigration events from a location during a six month long period, vs. the fraction of the yearly incidence in the corresponding six month period in the source location. (B) The fraction of the total emigration events from a location during a six month long period, vs. the fraction of the yearly positive growth in the corresponding six month period in the source location. (C) The fraction of the total immigration events to a location during a six month long period, vs. the fraction of the yearly incidence in the corresponding six month period in the destination location. (D) The fraction of the total immigration events to a location during a six month long period, vs. the fraction of the yearly positive growth in the corresponding six month period in the destination location.
