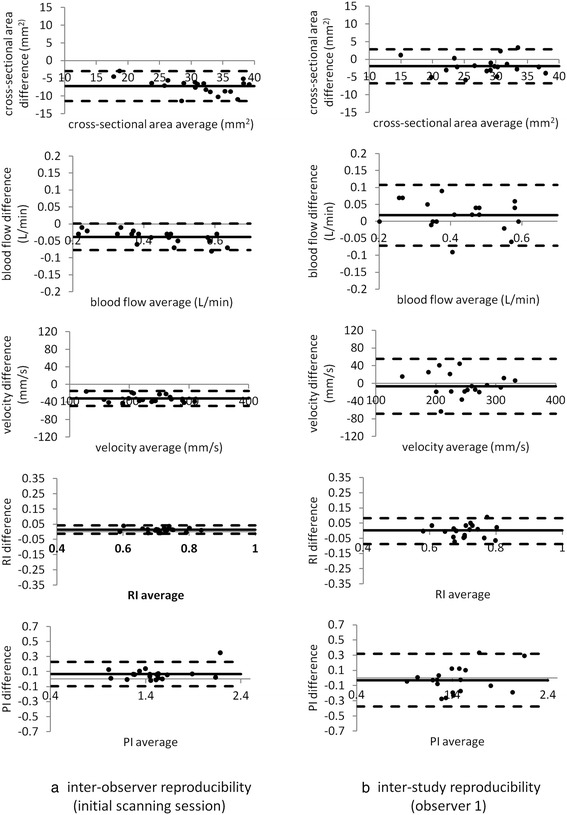
Figure 2.

Bland Altman plots showing inter-observer reproducibility of measurements of cross-sectional area, RABF, mean flow velocity, PI and RI (initial scanning session) (a). Corresponding plots for the inter-study reproducibility (observer 1) are shown in (b).
