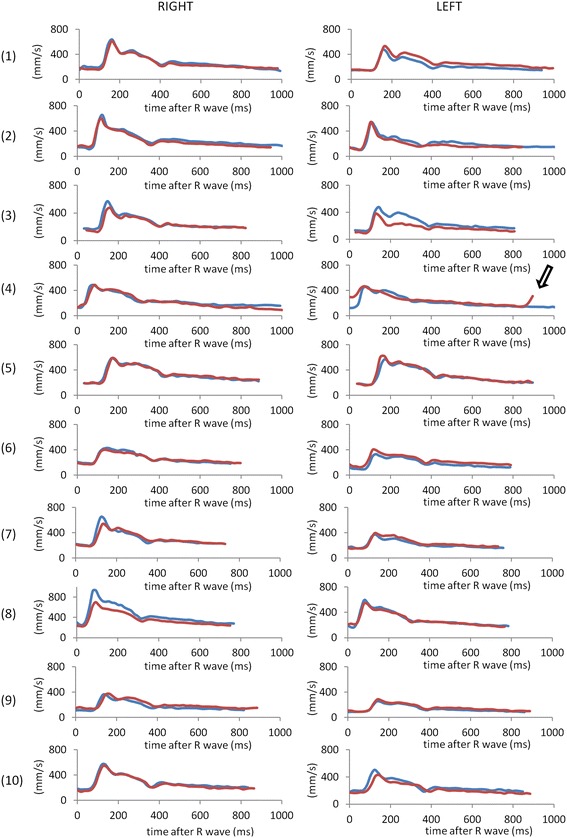
Figure 3.

Velocity-time curves in the initial (blue) and repeat (red) scanning sessions in all 10 subjects, as determined by observer 1. In the repeat left acquisition in subject 4, a much reduced RR interval (895 ms vs 1095 ms) and ECG mis-triggering (open arrow) resulted in velocity-time curve errors and this acquisition was omitted from all further analyses. (For all graphs, x-axis: time after R-wave (ms), y-axis: mean velocity (mm/s)).
