
Fig 1.
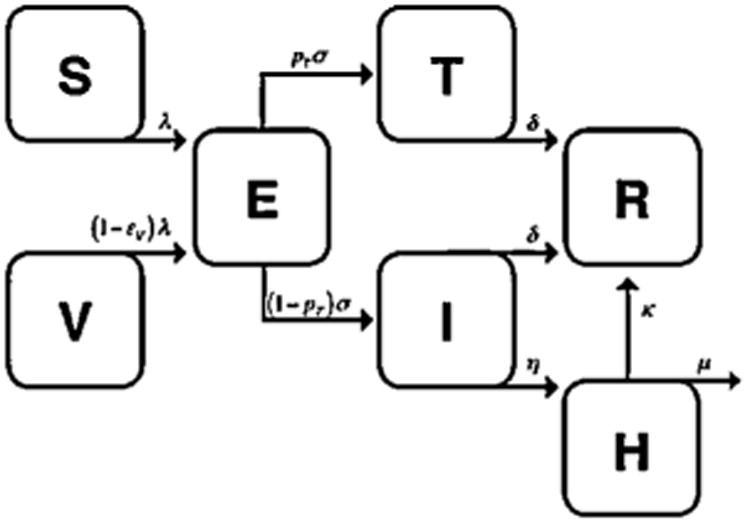
Diagram of compartmental model of influenza transmission. Compartments correspond to susceptible [S], latently infected [E], infectious [I], recovered [R], vaccinated [V], treated [T] and hospitalized [H] individuals. λ corresponds to force of infection, 1/σ to duration of incubation period, η to rate of hospitalization, κ to rate of recovery following hospitalization, and μ to flu mortality rate. The remaining rates are described in Table 1.