Fig. 3.

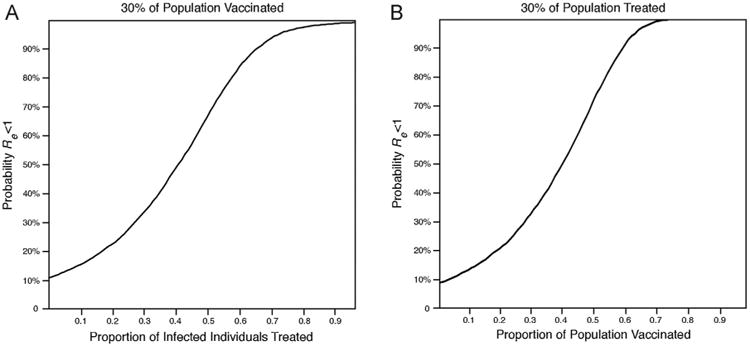
Probability that Re is below one (A) for varying levels of treatment when proportion vaccinated is 0.3 and (B) for varying levels of vaccination when proportion treated is 0.3.

Probability that Re is below one (A) for varying levels of treatment when proportion vaccinated is 0.3 and (B) for varying levels of vaccination when proportion treated is 0.3.