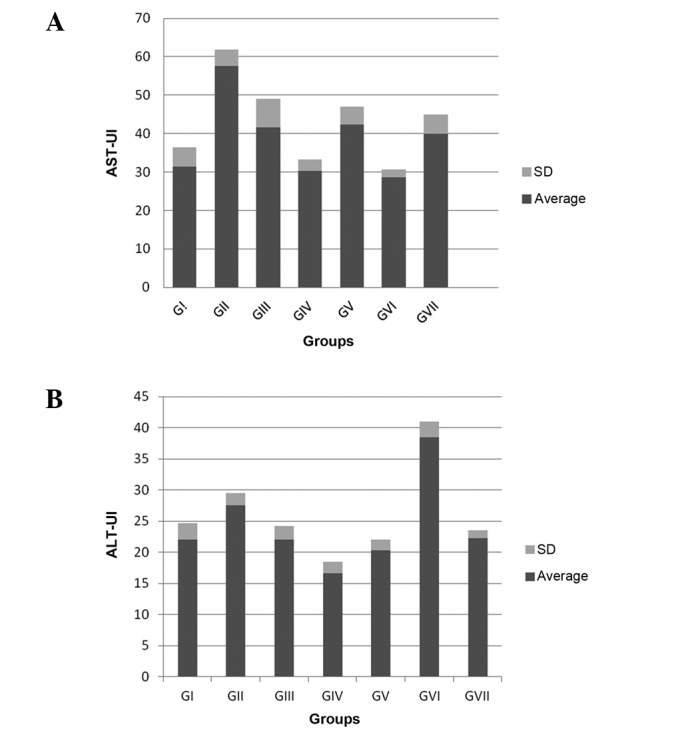
Figure 1.

AST and ALT levels. (A) AST levels and (B) ALT levels in rats treated with CCl4, ethanol, and CCl4 plus ethanol in the presence and absence of GTE. Groups: GI, normal control; GII, CCl4 plus ethanol; GIII, CCl4 plus ethanol plus GTE; GIV, ethanol; GV, ethanol plus GTE; GVI, CCl4; GVII, CCl4 plus GTE. AST, aspartate aminotransferase; ALT, alanine aminotransferase; SD, standard deviation; CCl4, carbon tetrachloride; GTE, green tea extract.
