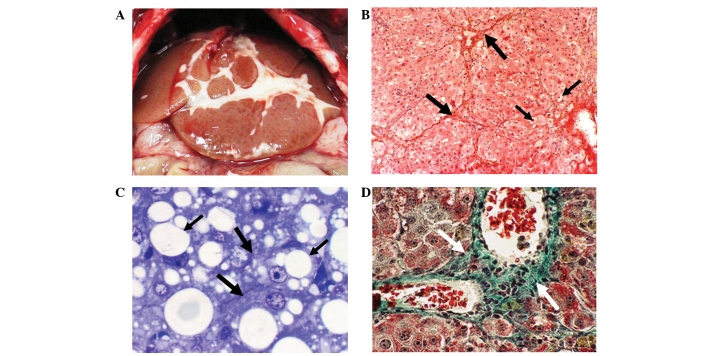
Figure 3.
Images from a GII rat. (A) Abnormal fatty liver of a GII rat. (B) Hematoxylin and eosin-stained section of the liver. Intermingled fibrous materials are observed among the hepatocytes (large arrows) as well as vacuolations and lipid droplets (small arrows; magnification, ×100). (C) Toluidine blue-stained section of the liver. Intermingled fibrous materials are observed among the hepatocytes (large arrows) as well as vacuolations and lipid droplets (small arrows; magnification, ×1,000). (D) Masson’s trichrome-stained section of the liver showing the accumulation of collagen fibers in the extracellular matrix (white arrows); the image shows a number of areas of lipid droplets and inflammation (magnification, ×400). GII, carbon tetrachloride plus ethanol group.

