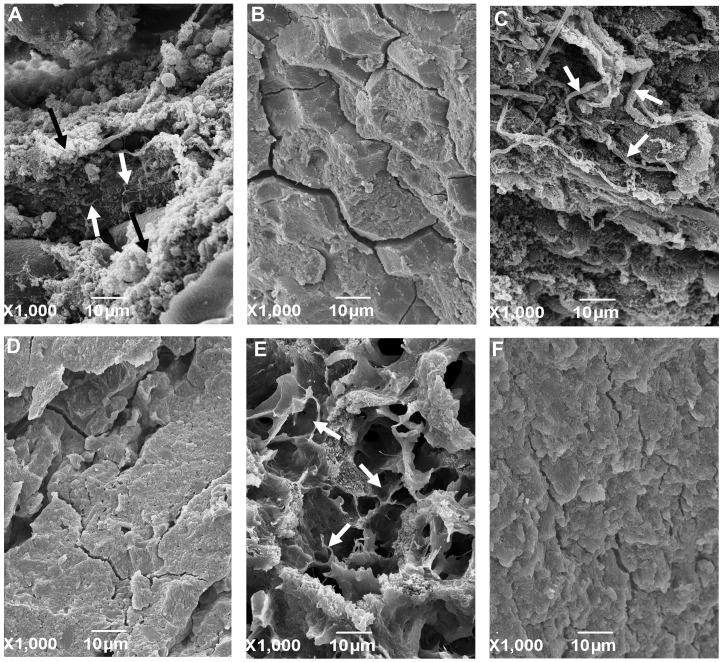
Figure 6.
Scanning electron microscope images of the rat liver extracellular matrix. (A) GII rat with collagen fiber formation due to CCl4 (white arrows) and ethanol (black arrows). (B) GIII rat with reduced presence of collagen fibers. (C) GVI rat with collagen fiber formation due to CCl4 (white arrows). (D) GVII rat with reduced presence of collagen fibers. (E) GIV rat with collagen fiber formation (white arrows). (F) GV rat with no collagen fibers. Groups: GII, CCl4 plus ethanol; GIII, CCl4 plus ethanol plus GTE; GIV, ethanol; GV, ethanol plus GTE; GVI, CCl4; GVII, CCl4 plus GTE. CCl4, carbon tetrachloride; GTE, green tea extract.

