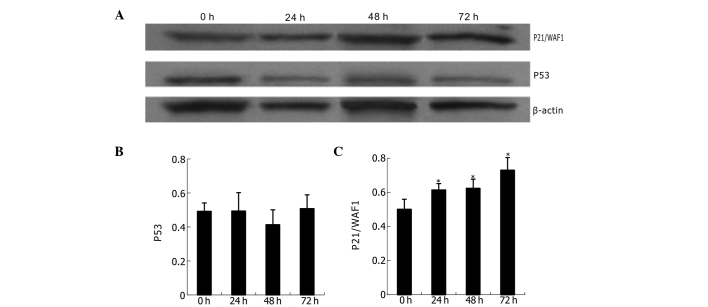
Figure 7.
Western blots of p53 and p21/WAF1 protein in K562 cells treated with naringenin. (A) Western blot analysis of p53 and p21/WAF1 protein expression in K562 cells; β-actin was used as internal standard. (B) and (C) Bar charts of the relative content analysis of p53 and p21/WAF1, respectively, which were calculated by comparing the target gene to the internal reference β-actin. Naringenin was used at a dose of 400 μmol/l. *P<0.05 vs. 0 h.

