
Figure 5.
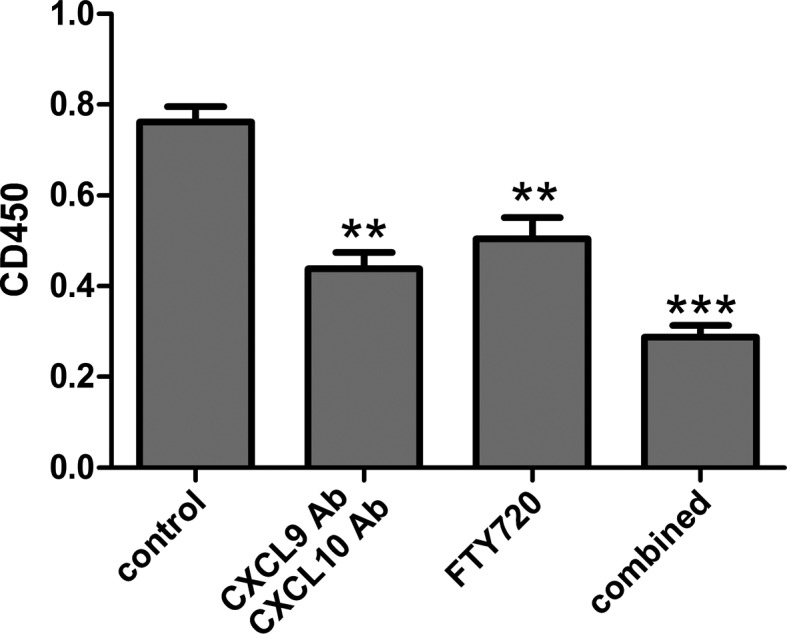
Effect of drug treatment on T-cell proliferation. The proliferative response in each group was assessed with the mixed lymphocyte reaction. **P<0.01 and ***P<0.001 vs. the control group. Combined group, CXCL9 Ab + CXCL10 Ab + FTY720; CXCL, C-X-C motif chemokine; Ab, antibody; CD, cluster of differentiation.