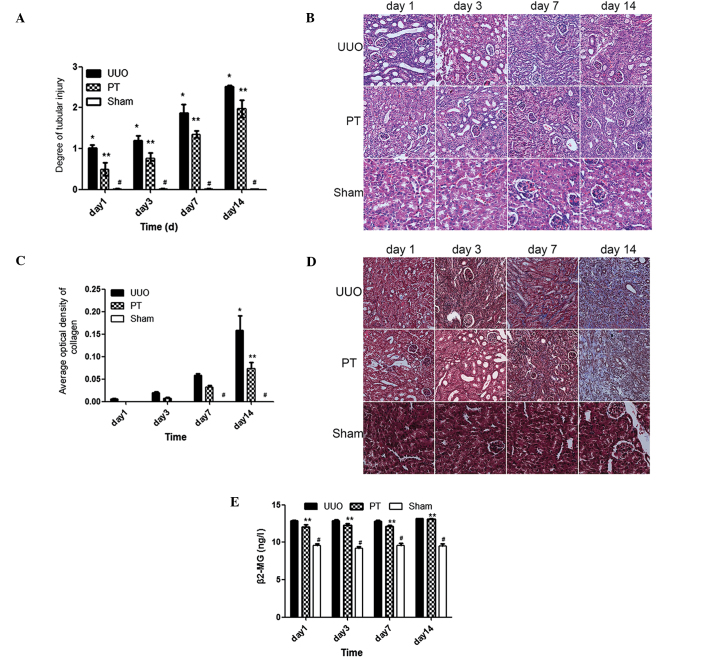
Figure 2.
(A) Tubular injury score in each group. Data are expressed as the mean ± standard error of the mean (n=3 or 4). *P<0.001 vs. the PT group; **P<0.001 vs. the sham group; #P<0.001 vs. the unilateral ureteral obstruction (UUO) group. (B) Hematoxylin and eosin staining images in obstructed renal tissue for each group (magnification, ×200). (C) Renal collagen content in each group. *P<0.001 vs. the PT group; **P<0.01 vs. the sham group; #P<0.01 vs. the UUO group. (D) Masson’s staining images in obstructed renal tissue for each group (magnification, ×200). (E) β-2-microglobulin (β2-MG) concentration changes in 24-h urine for each mouse group; **P<0.001 vs. the sham group; #P<0.001 vs. the UUO group. (B and C) Data are expressed as the mean ± standard error of the mean (n=3 or 4). PT group, mice with UUO treated with 8-(p-sulfophenyl)theophylline.

