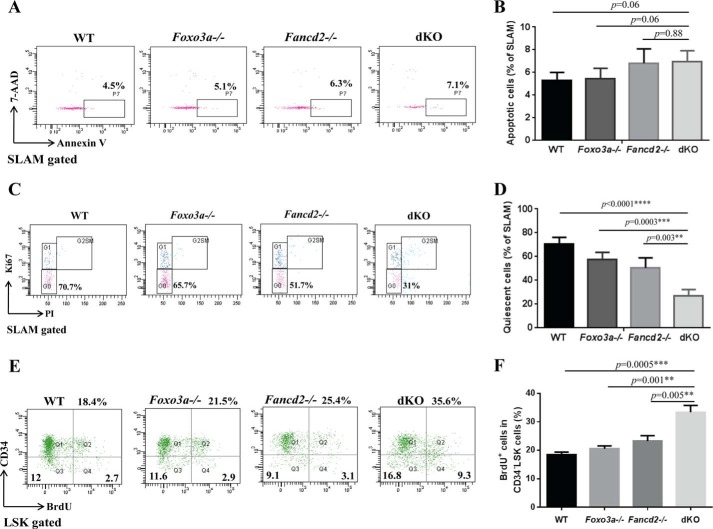
FIGURE 2.
Loss of Fancd2 and Foxo3a increases proliferation of HSCs. A, flow cytometric analysis of apoptotic cells within the phenotypic HSC (SLAM) population. BM cells of WT, Foxo3a−/−, Fancd2−/−, and Foxo3a−/− Fancd2−/− dKO mice were gated for the SLAM population and analyzed for annexin V-positive cells. 7-AAD, 7-aminoactinomycin D. B, quantification of annexin V-positive cells within the SLAM population. Each group comprises six mice. C, cell cycle analysis of SLAM cells. BM cells of WT, Foxo3a−/−, Fancd2−/−, and Foxo3a−/− Fancd2−/− dKO mice were gated for the SLAM population and analyzed for cell cycle phases by flow cytometry. Representative dot plots of DNA content (PI) were plotted versus Ki-67 staining. G0, Ki-67− and 2n DNA; G1, Ki-67+ and 2n DNA; G2SM, Ki67+ and DNA>2n. D, quantification of quiescent (G0) cells within the SLAM population. Each group comprised six mice. E, BrdUrd incorporation analysis of CD34−LSK cells. WT, Foxo3a−/−, Fancd2−/−, and Foxo3a−/− Fancd2−/− dKO mice at the age of 4–6 weeks were injected with a single dose of BrdUrd. 48 h later, the mice were sacrificed, and BM cells were analyzed for BrdUrd positive cells by flow cytometry. F, quantification of BrdUrd positive cells in the CD34−LSK cells. Each group comprises four to six mice. **, p < 0.01; ***, p < 0.001; ****, p < 0.0001.

