FIGURE 3.
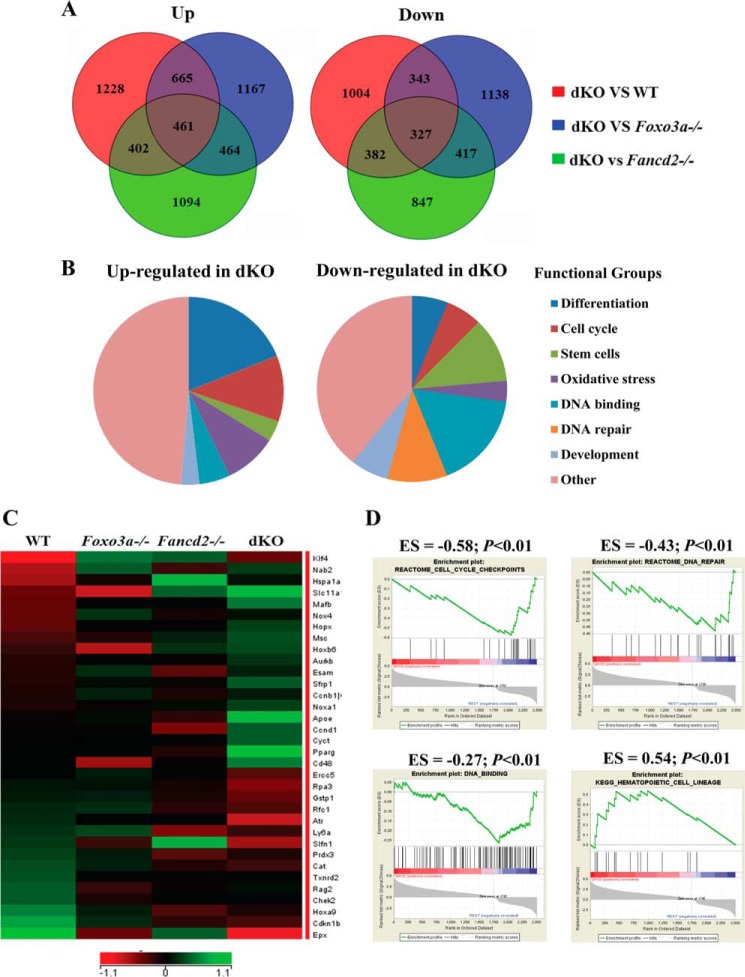
Global gene expression analysis of phenotypic HSCs. Whole genome microarray data were obtained from freshly isolated SLAM (LSK CD150+CD48−) cells from WT, Foxo3a−/−, Fancd2−/−, and dKO mice. A, Venn diagrams illustrating the overlap between genes up-regulated and down-regulated in WT, Foxo3a−/−, Fancd2−/−, and dKO SLAM cells. B, pie charts show the distribution of the 461 up-regulated and the 327 down-regulated genes in dKO SLAM cells into functional groups. C, heat map displays the expression of genes with cell cycle checkpoint, DNA repair, oxidative stress, and HSC differentiation-related functional annotations that are significantly down-regulated and up-regulated in dKO SLAM cells. The rows correspond to genes, and the columns correspond to samples. Gene expression values are indicated on a log2 scale according to the color scheme shown. Unregulated and down-regulated genes are presented in green and red, respectively. D, GSEA analyses are shown for gene sets identified for cell cycle checkpoints, DNA repair, DNA binding, and HSC differentiation pathways. For each GSEA, the p value and enrichment score (ES) are shown above each pathway graph.

