
FIGURE 1.
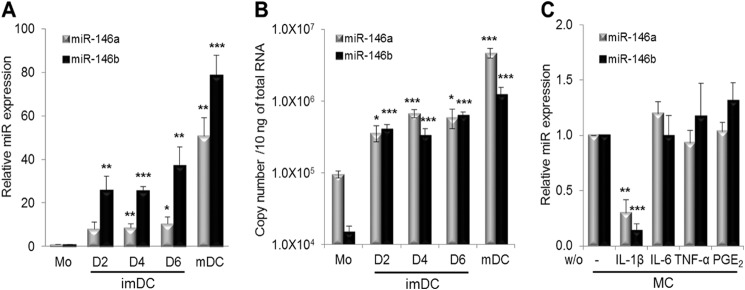
miR-146 expression during monocyte differentiation into imDCs and mDCs. A, miR-146a and miR-146b expression in human monocytes (Mo) at day (D) 0; imDCs at days 2, 4, and 6; and mDCs at day 8 was analyzed by real-time PCR analysis. B, copy numbers of miR-146a and miR-146b. C, effect of the individual component in the maturation mixture on miR-146a and miR-146b expression. imDCs at day 6 were treated for 2 days with maturation mixture (MC) consisting of 10 ng/ml IL-1β, IL-6, and TNF-α and 1 μg/ml PGE2, from which the individual cytokine was excluded. The relative expression of miR-146a and miR-146b was quantified by real-time PCR and normalized to mDCs that had been treated with the full maturation mixture. Data shown are mean percentages ± S.E. of four (A), two (B), or three (C) independent experiments. *, p < 0.05; **, p < 0.01; ***, p < 0.005. w/o, without.