
FIGURE 2.
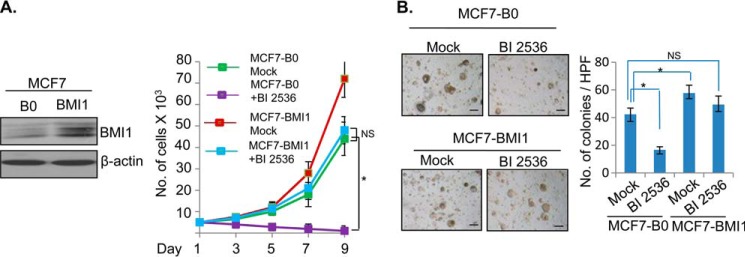
BMI1 overcomes inhibition of oncogenic phenotypes induced by PLK1 inhibitor BI 2536. A, left panel, MCF7 cells stably expressing BMI1 were generated by infecting cells with pBabe-BMI1 and selecting cells in puromycin (1 μg/ml for 5 days). MCF7 vector control (MCF7-B0) and MCF7-BMI1 cells were treated with 50 nm BI 2536 and allowed to grow for 3–9 days. Cells were counted at 3, 5, 7, and 9 days, and total number of cells plotted against number of days. B, MCF7-B0 control and MCF7-BMI1 cells were seeded in soft agar and treated with DMSO (mock) or 50 nm BI 2536 in DMSO added to the medium/soft agar, and allowed to form colonies for 10 days. The colonies were photographed under 10× magnification (mag), counted and plotted as a bar graph. The experiments were done in triplicates. Error bars represent ± S.D. *, p < 0.05 (significant); NS, not significant. Scale bars, 20 μm.