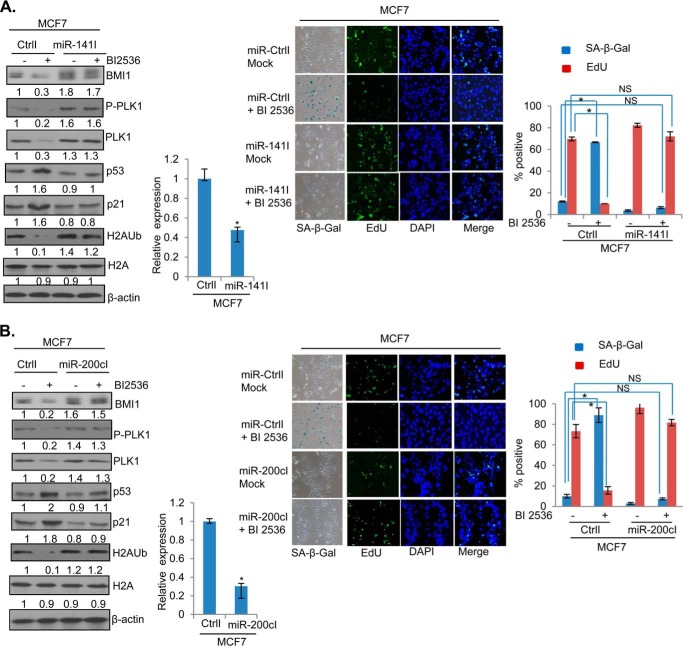
FIGURE 8.
Inhibition of miR-200c/141 overcomes senescence induction by BI 2536 in MCF7 cells. A, MCF7 cells overexpressing either a control inhibitor (CtrlI) or miR-141 Inhibitor (miR-141I) were treated with BI 2536 or DMSO (mock) and analyzed for the expression of BMI1, phospho-PLK1, PLK1, H2AK119Ub, total H2A, p53, p21, and β-actin by the Western blot analysis as described in Fig. 1 (left panel). MCF7-CtrlI and MCF7-miR-141I cells were also analyzed for the expression of miR-141 by qRT PCR analysis. The SA-β-gal/EdU co-staining was carried out in BI 2536-treated MCF7 cells expressing (CtrlI), miR-141Inhibitor (miR-141I) and quantification of senescent (SA-β-gal-positive) and proliferating (EdU-positive) cells was done as described in Fig. 6. In this experiment EdU staining was detected using FITC-labeled secondary antibody (right panel). B, MCF7 cells expressing a control inhibitor (CtrlI) or miR-200c inhibitor (miR-200cI) were mock- and BI 2536-treated and studied by Western blot analysis and markers of senescence (SA-β-gal/Edu) co-staining as described above for miR-141 inhibitor experiment. Each experiment was done in triplicates. The error bars represent ± S.D. *, p < 0.05 (significant); NS, not significant.

