FIGURE 2.
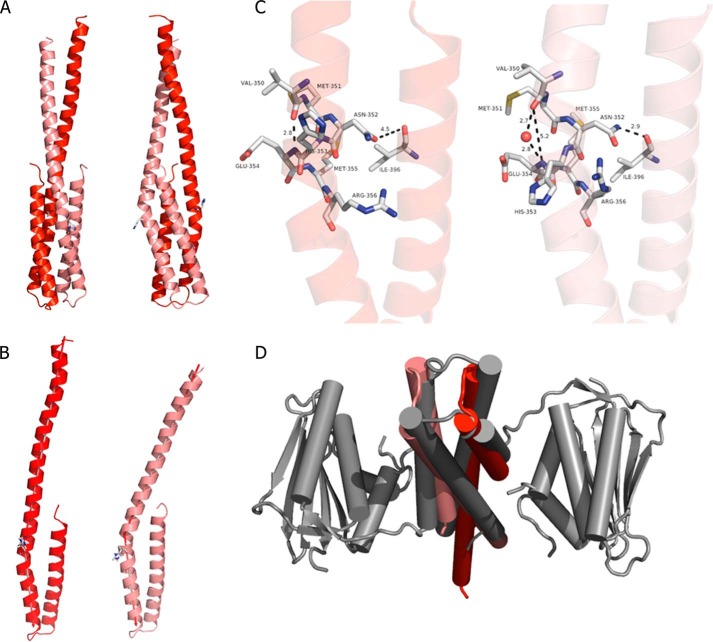
Dimerization domain of ERS1 (DHpERS1). A, schematic representation in two orientations separated by 90°. The two hairpins per dimer are colored dark (chain A) and light red (chain B), respectively, with the scheme being preserved in all panels of the image. B, superposition of DHpERS1 (res. 353–404) highlighting the effect of the kink on the N-terminal section of the domain. The axis used to calculate the angle between the helices is indicated. C, comparison of the region around the phosphoryl-accepting histidine residue (shown as sticks) with α1 (small kink; left) and α1′ (large kink; right) with selected residues shown as sticks and atom distances shown as dashed lines. D, comparison of the topology of the hairpin loops of DHpERS1 (red) and HK853 (gray).

