FIGURE 5.
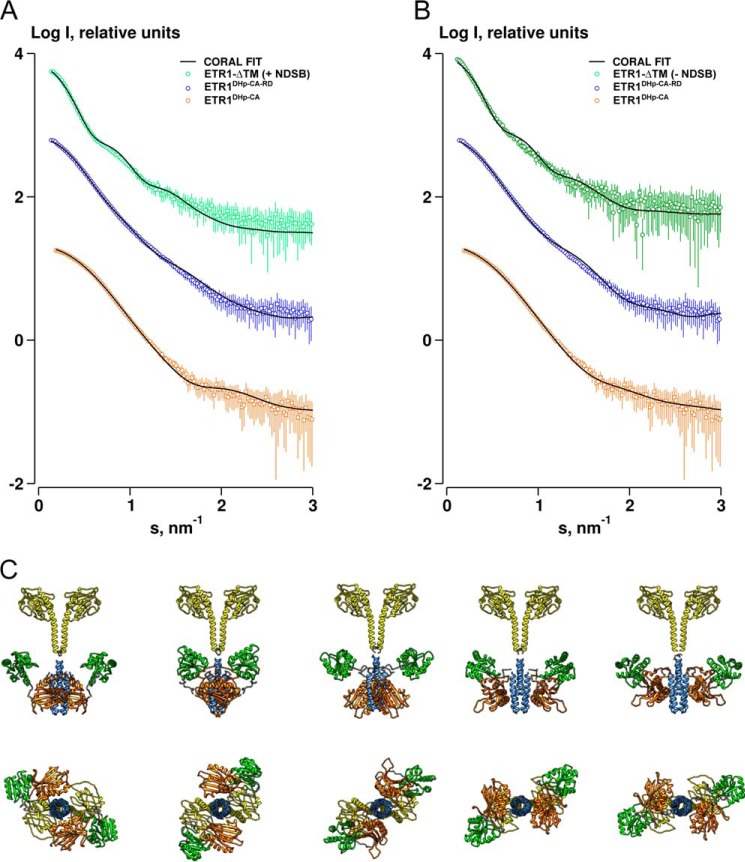
Rigid body refinement of ETR1-ΔTM. A, model refined in a global fit against data from three constructs, including 250 mm NDSB data for the cytoplasmic domains of ETR1. Discrepancies (χ) for the fit of the models to the ETR1-ΔTM, ETR1DHp-CA-RD, and ETR1DHp-CA data with 250 mm NDSB are 1.5, 1.1, and 1.3, respectively. Discrepancies (χ) for the fit of the models to the ETR1-ΔTM, ETR1DHp-CA-RD, and ETR1DHp-CA data without NDSB are 1.4, 1.2, and 1.4, respectively. B, model refined as in A but using data without NDSB for the cytoplasmic domains of ETR1 at low protein concentration. C, ensemble of rigid body models of ETR1-ΔTM refined against SAXS data. Models at the bottom are rotated through 90° relative to those above. The GAF, DHp, CA, and RD domains are colored yellow, blue, orange, and green, respectively.

