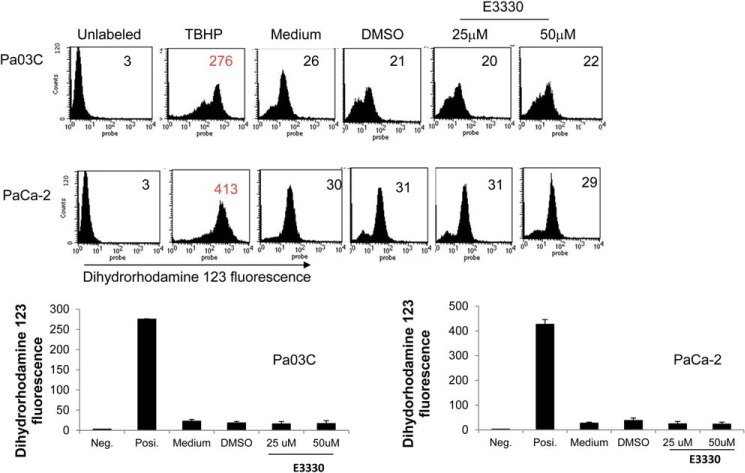
FIGURE 5.
The increase in NRF2 activity is not due to an increase in ROS. Quantitation of ROS by DHR-123 fluorescence following inhibition of Ref-1 demonstrates no increase in ROS in either patient-derived or PaCa-2 cells. Cells were treated with E3330 for 24 h and harvested for ROS levels. Positive control tert-butyl hydroperoxide (TBHP) shows a significant increase in ROS generation as expected. Error bars, ±S.E.

