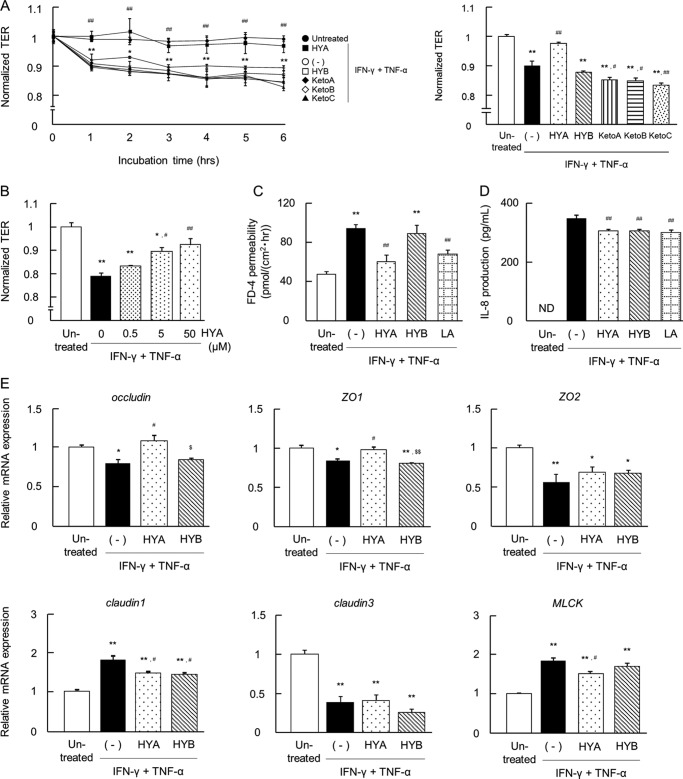
FIGURE 2.
Effects of fatty acids on IFN-γ + TNF-α-induced barrier impairment in Caco-2 cells. A, Caco-2 cells were treated with the fatty acids (50 μm each) for 24 h and then stimulated with IFN-γ + TNF-α. Time course changes in TER were monitored (n = 3) (left). ●, untreated; ○, IFN-γ + TNF-α (−); ■, IFN-γ + TNF-α + HYA; □, IFN-γ + TNF-α + HYB; ♦, IFN-γ + TNF-α + KetoA; ♢, IFN-γ + TNF-α + KetoB; ▴, IFN-γ + TNF-α + KetoC. The data on TER at 6 h is shown (right). p < 0.05 and **, p < 0.01, compared between untreated (●) and IFN-γ + TNF-α (−); #, p < 0.05 and ##, p < 0.01, compared between IFN-γ + TNF-α + HYA (■) and IFN-γ + TNF-α (−) (Tukey-Kramer). B, recovery of TER at 6 h was examined with varying concentrations of HYA (0, 0.5, 5, and 50 μm) (n = 3). *, p < 0.05, and **, p < 0.01, compared with untreated; #, p < 0.05, and ##, p < 0.01, compared with IFN-γ + TNF-α (without HYA) (Tukey-Kramer). C, FD-4 permeability into the basal wells was assessed for 6 h (n = 3). LA, linoleic acid. D, after TER measurement at 6 h, the basal medium was collected and the IL-8 concentration was determined (n = 3). LA, linoleic acid. E, total RNA was extracted from Caco-2 cells at 6 h, and mRNA expression was examined by real time RT-PCR. Data are presented as the fold change in gene expression from the control (untreated), after normalization to the β-actin gene (n = 3). *, p < 0.05, and **, p < 0.01, compared with untreated; ##, p < 0.01, compared with IFN-γ + TNF-α (−); $, p < 0.05, and $$, p < 0.01, compared with HYA (Tukey-Kramer). Results are expressed as means ± S.E. Each result (in A–E) is representative of three independent similar experiments.

