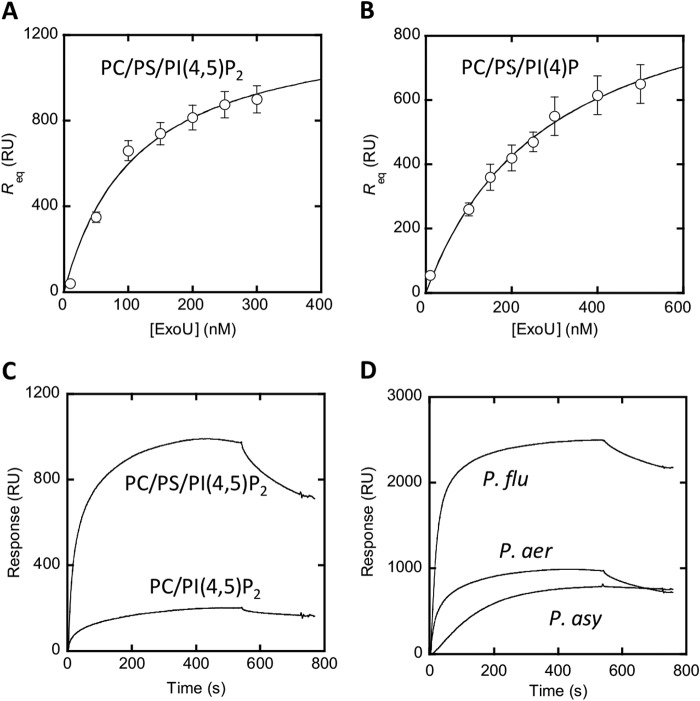
FIGURE 2.
Binding of ExoU to vesicles containing PI(4,5)P2 and PI(4)P measured by SPR analysis. A, determination of Kd for ExoU binding to PC/PS/PI(4,5)P2 (77:20:3) vesicles by equilibrium SPR analysis. The binding isotherm was generated from the Req (average of triplicate measurements) versus the concentration (P0) of ExoU plot. A solid line represents a theoretical curve constructed from Rmax (= 1300 ± 120) and Kd (= 110 ± 30 nm) values determined by nonlinear least squares analysis of the isotherm using the following equation: Req = Rmax/(1 + Kd/P0). B, determination of Kd values for ExoU binding to PC/PS/PI(4)P (77:20:3) vesicles by equilibrium SPR analysis. Rmax (= 1100 ± 60) and Kd (= 290 ± 30 nm) values were calculated as described for B. C, kinetic SPR sensorgrams for ExoUP. aer binding to PC/PS/PI(4,5)P2 (77:20:3) and PC/PI(4,5)P2 (97:3) vesicles. D, kinetic SPR sensorgrams for ExoUP. aer, ExoUP. flu, and ExoUP. asy binding to PC/PS/PI(4,5)P2 (77:20:3) vesicles. ExoUP. flu showed the highest degree of vesicle binding. Equilibrium SPR analysis confirmed that it has the highest affinity (Kd = 30 ± 6 nm). RU, resonance units. Error bars represent S.D.

