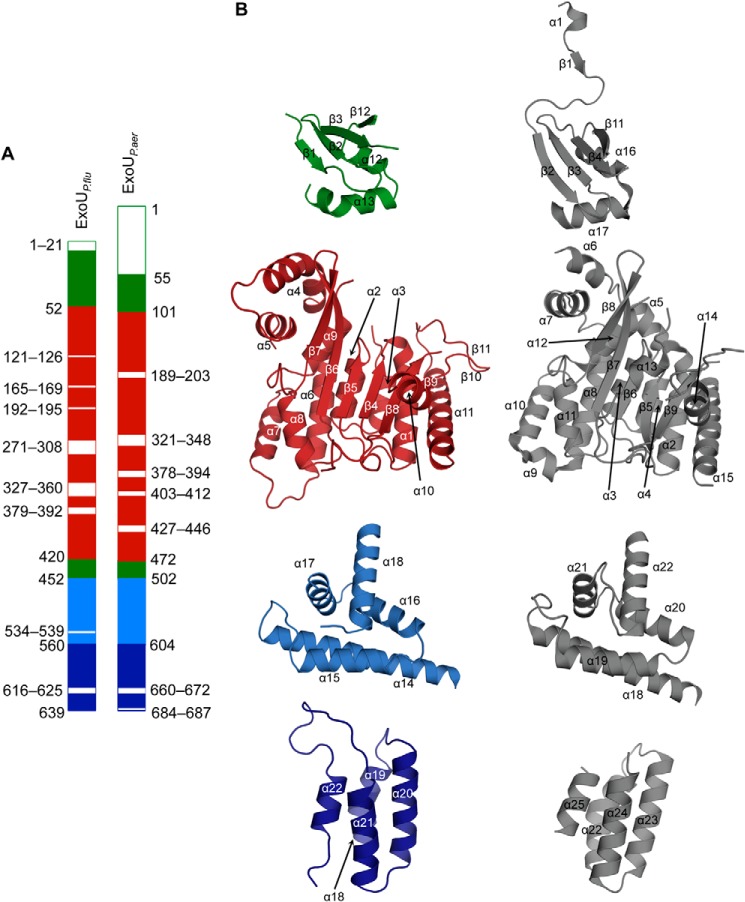
FIGURE 9.
Comparison of the ExoUP. flu and ExoUP. aer structures. A, linear depiction of ExoUP. flu and ExoUP. aer domains. The putative chaperone binding domain (domain 1) is shown in green, the patatin PLA2 domain (domain 2) in red, and the MLD in blue. The MLD is composed of domain 3 (light blue) and domain 4 (dark blue). Disordered regions in both structures are shown in white. B, domain-to-domain comparisons of the least squares superimposed ExoUP. flu (colored as in A) and ExoUP. aer (gray) structures.

