
FIGURE 4.
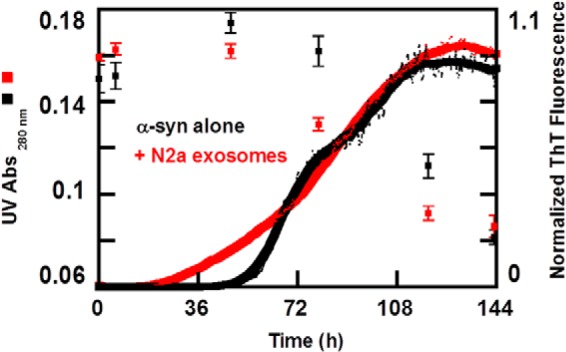
α-syn monomer concentration during the aggregation process. Normalized aggregation kinetics for 30 μm α-syn (black line) in the presence of 0.25 mg/ml exosomes (red line) followed by ThT fluorescence in 10 mm MES, pH 5.5, with 140 mm NaCl. The average traces are shown in bold. In parallel to the ongoing aggregation process, solubility changes of α-syn alone (black squares) and in the presence of 0.25 mg/ml exosomes (red squares) were monitored. Samples were collected at different stages of the aggregation profile and centrifuged, and absorbance measurements were preformed to the supernatant. Each time point therefore represents an average value of at least three repeated absorbance measurements of soluble monomeric α-syn with respective standard deviation bar represented. Well depicted is the correlation between monomer depletion and fibril elongation in the presence and absence of exosomes.