FIGURE 8.
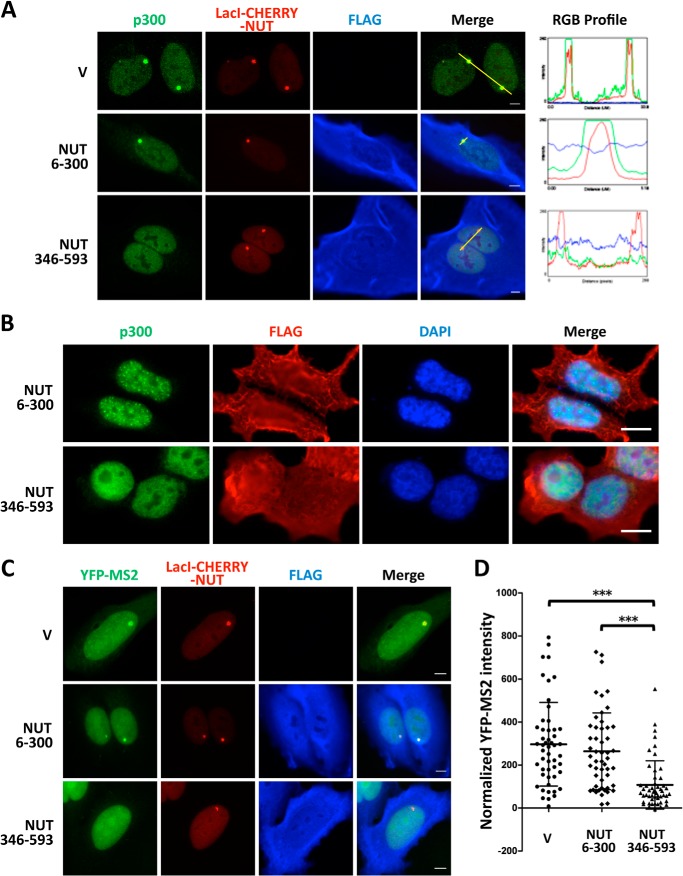
Blocking NUT-p300 interaction using a NUT 346–593 dominant-negative inhibitor prevents p300 recruitment and represses NUT-mediated transgene activation. A, U2OS 2-6-3 cells were transfected with LacI-CHERRY-NUT together with either the empty vector (V) or constructs encoding FLAG-tagged NUT 6–300 or the NUT 346–593 fragment. Cells were fixed 24 h after transfection and immunostained with p300 (green) and FLAG (blue) antibodies. The RGB intensity profiles in the right panel show the intensity curve of red, green, and blue signals along the highlighted yellow bars in the Merge panel. Scale bars = 5 μm. B, HCC2429 cells were transfected with constructs encoding FLAG-tagged NUT 6–300 or NUT 346–593. 24 h post-transfection, cells were fixed and immunostained with p300 (green) and FLAG (red) and counterstained with DAPI. Scale bars = 10 μm. C, U2OS 2-6-3 YFP-MS2 stable cells were transfected with LacI-CHERRY-NUT together with either the empty vector or constructs encoding FLAG-tagged NUT 6–300 or the NUT 346–593 fragment. Cells were fixed 24 h after transfection and immunostained with the FLAG antibody. Scale bars = 5 μm. D, quantitative single-cell image analysis of the YFP-MS2 intensity at the transgene array locus. The average YFP-MS2 intensity of the transgene array was quantified for more than 50 cells in each sample transfected in C using ImageJ. Data represent the mean ± S.D. ***, p < 0.001.

