
FIGURE 5.
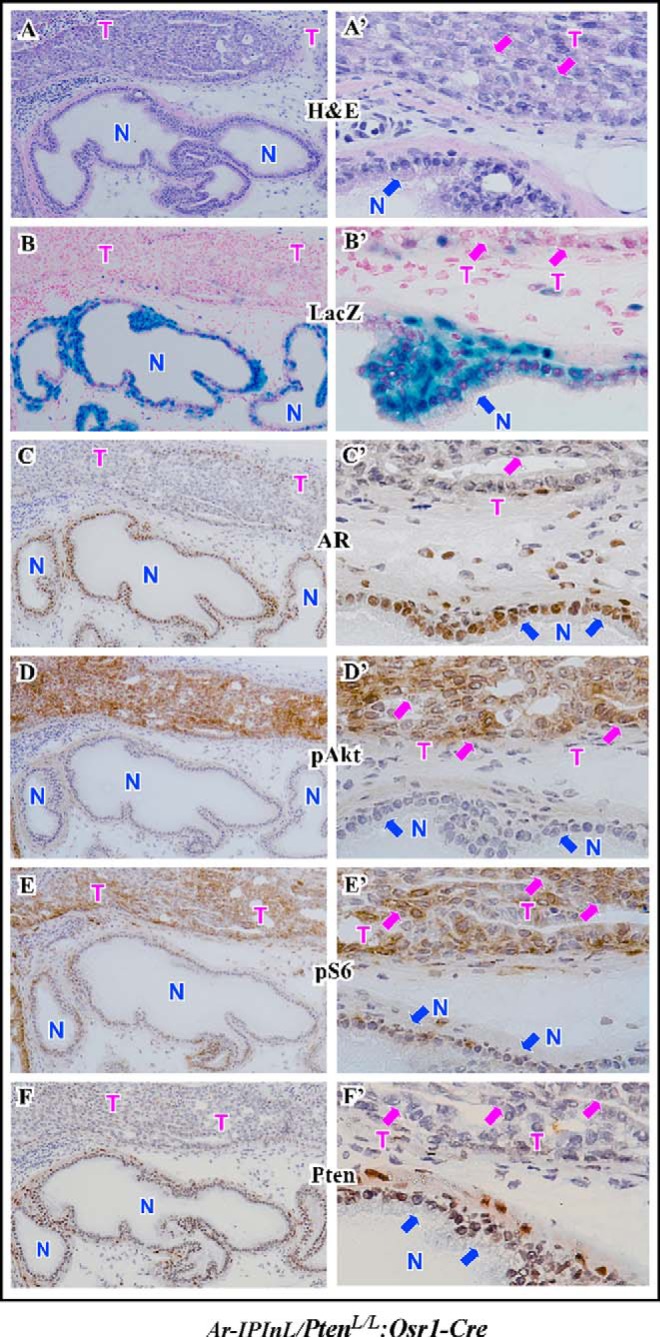
Analysis of endogenous Ar expression and Akt expression and activation in the mouse prostate. Serially adjacent frozen sections of prostate tissues isolated from 5-week-old Ar-IPInL:PtenloxP/loxP:Osr1-Cre mice were stained with hematoxylin and eosin (A), stained for β-gal activity (B), and stained with the antibodies against AR, pAkt, pS6, and Pten (C–F). Corresponding high power images (400×) are shown in A′–F′. N indicates normal glands. T indicates tumor areas.