

Background: How the absence of lysosomal enzyme acid α-glucosidase causes hypertrophic cardiomyopathy in Pompe disease is unknown.
Results: Pompe patient-induced pluripotent stem cell-derived cardiomyocytes have normal autophagic and contractile function but exhibit a deficit of Golgi-based protein glycosylation.
Conclusion: Loss of the lysosomal glycogen hydrolyzing ability results in protein glycosylation deficits.
Significance: Malfunctioning proteins due to misglycosylation may contribute to the pathophysiology of Pompe cardiomyopathy.
Keywords: Autophagy, Cardiomyopathy, Golgi, Induced Pluripotent Stem Cell (iPSC), Lysosomal Glycoprotein, N-linked Glycosylation, Tissue Engineering, Pompe Disease
Abstract
Infantile-onset Pompe disease is an autosomal recessive disorder caused by the complete loss of lysosomal glycogen-hydrolyzing enzyme acid α-glucosidase (GAA) activity, which results in lysosomal glycogen accumulation and prominent cardiac and skeletal muscle pathology. The mechanism by which loss of GAA activity causes cardiomyopathy is poorly understood. We reprogrammed fibroblasts from patients with infantile-onset Pompe disease to generate induced pluripotent stem (iPS) cells that were differentiated to cardiomyocytes (iPSC-CM). Pompe iPSC-CMs had undetectable GAA activity and pathognomonic glycogen-filled lysosomes. Nonetheless, Pompe and control iPSC-CMs exhibited comparable contractile properties in engineered cardiac tissue. Impaired autophagy has been implicated in Pompe skeletal muscle; however, control and Pompe iPSC-CMs had comparable clearance rates of LC3-II-detected autophagosomes. Unexpectedly, the lysosome-associated membrane proteins, LAMP1 and LAMP2, from Pompe iPSC-CMs demonstrated higher electrophoretic mobility compared with control iPSC-CMs. Brefeldin A induced disruption of the Golgi in control iPSC-CMs reproduced the higher mobility forms of the LAMPs, suggesting that Pompe iPSC-CMs produce LAMPs lacking appropriate glycosylation. Isoelectric focusing studies revealed that LAMP2 has a more alkaline pI in Pompe compared with control iPSC-CMs due largely to hyposialylation. MALDI-TOF-MS analysis of N-linked glycans demonstrated reduced diversity of multiantennary structures and the major presence of a trimannose complex glycan precursor in Pompe iPSC-CMs. These data suggest that Pompe cardiomyopathy has a glycan processing abnormality and thus shares features with hypertrophic cardiomyopathies observed in the congenital disorders of glycosylation.
Introduction
Infantile-onset Pompe disease is an autosomal recessive glycogen storage disorder caused by the complete loss of acid α-glucosidase (GAA)2 activity, the sole enzyme responsible for hydrolyzing glycogen into free glucose within the lysosome. Without GAA activity, glycogen accumulates within the lysosomes and is associated with prominent pathological manifestations in skeletal and cardiac muscle. The disease presents during the first days to months of life, and without enzyme replacement therapy with recombinant human GAA, patients die within 1 year due to respiratory insufficiency or cardiac complications including arrhythmias and heart failure (1, 2). Enzyme replacement therapy represents a major breakthrough in prolonging survival, but the treatment is not curative and has significant limitations. For example, patients can develop immune reactivity to the intravenously administered enzyme (3). Skeletal muscle often becomes refractory to treatment due to the endosomal and autophagic sequestration of recombinant human GAA, which prevents it from reaching the lysosomes, resulting in the reaccumulation of glycogen (4). Although the cardiomyopathy can be suppressed indefinitely if treatment is initiated early, long-term treatment is complicated by arrhythmias (5, 6). Thus, there remains significant need to further advance the understanding of Pompe pathophysiology in order to improve treatment strategies.
The mechanisms by which lack of GAA activity and lysosomal glycogen accumulation cause muscle pathology have been investigated primarily in skeletal muscle. Electron micrographs of patient skeletal muscle demonstrate a progressive replacement of contractile structures with glycogen-filled lysosomes and free glycogen (7). Moreover, both intact and skinned muscle fibers from the Pompe mouse model produce less force, compared with healthy controls (8). While these data provide some explanation for the global skeletal muscle weakness, mechanisms leading to the early cardiac phenotype of hypertrophic cardiomyopathy are largely unknown.
Autophagic dysfunction has been implicated as an upstream pathology leading to skeletal muscle wasting (9, 10). Pompe skeletal muscle has accumulations of autophagosomes and ubiquitinated protein aggregates, indicating that the lysosomes are not digesting intracellular materials at a sufficient rate (11). The observation that glycogen-filled lysosomes have neutral pH supports the argument for lysosomal incompetence (12). Lysosomal rupture and insufficient clearance of old/damaged mitochondria (mitophagy) are hypothesized to be direct mechanisms of contractile protein loss via release of acid and hydrolytic enzymes into the cytosol and increased mitochondrial reactive oxygen species production (13).
In cardiac muscle the pathology differs with the development of hypertrophy rather than atrophy. Whether autophagy is central to cardiac pathophysiology is unknown (14). Pompe cardiomyopathy is classified as a hypertrophic cardiomyopathy because of the marked thickening of the ventricular walls and associated hyperdynamic systolic function with outflow tract obstruction. These features are shared with familial hypertrophic cardiomyopathies due to mutations in the myosin heavy chain genes or other myofilament genes in which abnormalities in contractile properties are thought to induce hypertrophy. Whether Pompe cardiomyocytes exhibit abnormalities in contractile function has not yet been investigated directly (15, 16).
In this study, we generated human induced pluripotent stem (iPS) cells from two different patients with infantile Pompe disease and differentiated them to iPS cell-derived cardiomyocytes (iPSC-CMs) as a model to study the cardiac manifestations of Pompe disease. The Pompe iPSC-CMs exhibited undetectable GAA activity and pathognomonic glycogen-filled lyososomes. Engineered cardiac tissue (ECT) generated from Pompe and control iPSC-CMs demonstrated no consistent differences in contractile strength or kinetics. Moreover, Pompe iPSC-CMs were capable of lysosomal digestion of autophagosomes to the same extent as controls. However, we observed differences in the electrophoretic mobilities and isoelectric points of lysosome-associated membrane proteins (LAMPs) from Pompe iPSC-CMs in comparison with control iPSC-CMs. We provide evidence of Pompe iPSC-CM-specific deficits in LAMP1 and LAMP2 glycosylation as well as global deficits in N-linked glycan synthesis that occur in the Golgi. We propose that infantile Pompe disease may share disease mechanisms with other congenital disorders of glycosylation that have similar Golgi-based glycosylation deficiencies and also have clinical presentations that include hypertrophic cardiomyopathy and muscle weakness early in life (17, 18).
EXPERIMENTAL PROCEDURES
Generation of iPS Cells from Skin Fibroblasts
Patient dermal fibroblasts (I.D. GM20089, GM20123, and GM04912) were purchased from the National Institute of General Medical Sciences Human Genetic Cell Repository at the Coriell Institute for Medical Research and reprogrammed into iPS cells using the six-factor (OCT4, NANOG, SOX2, KLF4, LIN28, and cMYC) lentiviral transfection protocol (19). The iPS cells were cultured with the TeSR/Matrigel system (20), verified as pluripotent with teratoma assays in SCID/beige mice, and Giemsa band-karyotyped before aliquots were frozen for later experimentation.
Acid α-Glucosidase Genotyping, Activity Assay, and Immunodetection
Pompe line GM04912 gDNA was PCR-amplified with the G→A and delT primers listed in Table 1. The PCR products were agarose gel purified and directly cycled sequenced. The del ex18 primers given in Table 1 were used to amplify the region containing the exon 18 deletion in Pompe line GM20089. The PCR products were then separated on an agarose gel. Acid glucosidase activity was measured by hydrolysis of 4-methylumbelliferyl-α-d-glucoside (4-MUG, Sigma) at pH 4 to release the fluorophore 4-methylumbelliferone (4-MU) as described previously (21). GAA protein from iPS cells was immunoblotted with rabbit polyclonal anti-GAA (gift from Duke Glycogen Storage Disease Laboratories) using the one-dimensional Western blotting procedure described below.
TABLE 1.
Primers for GAA genotyping
Genomic DNA from iPS cells was amplified with the tabulated primer pairs and the GoTaq Green (Promega) polymerase mix. The DNA products were analyzed as described under “Experimental Procedures.”
| Mutation | Direction | Primer sequence |
|---|---|---|
| 5′-3′ | ||
| del ex18 | Forward | CTCCTCACACCATCCCCATT |
| del ex18 | Reverse | CACGTACCAGCTCATTCACG |
| G→A | Forward | CATACGTTCCTCTTTCCGCC |
| G→A | Reverse | AATTCAGCCTCTTCCTGTGC |
| delT | Forward | CAATCCACATGCCGTCGAAG |
| delT | Reverse | AGCTGCTCATTGACCTCCAG |
Differentiation of iPS Cells into Cardiomyocytes
The iPS cell lines were differentiated into cardiomyocytes using a small molecule-directed differentiation protocol in a 12-well plate format (22). Once differentiated, cardiomyocytes were maintained in RPMI medium (Invitrogen) supplemented with B27 (Invitrogen) (RPMI/B27). At 30 days following initiation of differentiation, cells were dissociated with 10× TryPLE (Invitrogen) as clumps, replated onto gelatin-coated T75 flasks in DMEM/20% FBS for 2 days, and then maintained for another 8 days in RPMI/B27. Cells were then dissociated to single cells with 10× TryPLE and 1) used for ECT formation as described in the next section, 2) replated onto gelatin-coated 12-well plates (first 2 days in DMEM/20% FBS followed by RPMI/B27) at 1 million cells/well for protein studies, or 3) plated at a variety of densities on glass coverslips for immunocytochemistry. For electron microscopy, contracting regions were microdissected from original differentiation plates and replated on glass coverslips as three-dimensional clusters. After 10 days of culture, cardiomyocytes were ready for downstream experimentation. For certain protein studies, iPSC-CMs were treated with chloroquine (catalog No. C6628, Sigma) at 20 μm for 2 days or with brefeldin A (catalog No. B-8500, LC Laboratories) at 500 ng/ml for 2 days or cultured in 100 mm sucrose for 2 weeks.
Engineered Cardiac Tissue Preparation and Functional Testing
Differentiated cardiomyocytes were dissociated from T75 flasks and used to prepare fibrin-based ECTs with a protocol adapted from elsewhere (23, 24). Prior to ECT formation, 1 million cardiomyocytes from the single cell suspension were fixed in 2% paraformaldehyde and processed for cTnT (cardiac isoform Ab-1, Thermo Fisher Scientific) flow cytometry to determine CM purity. Only ECT data from CM preparations that were >80% cTnT+ were included in contractile analysis. The remaining CM suspension was cultured for 3 h on a rotating platform at 45 rpm in a 10-cm Petri dish in ECT medium. The composition of ECT medium is described in de Lange et al. (25) as “mouse media”. Cell clumps from the rotational culture were mixed with scaffolding reagents in the following ratios: 1.2 million cells:5 mg of fibrinogen:0.5 unit of thrombin in 200 μl total volume of ECT medium. Each ECT was prepared from 200 μl of the mixture pipetted into 20 × 3-mm cylindrical molds of the Flexcell Tissue Train silicone membrane culture plate (Flexcell International) according to methods detailed in de Lange et al. (25). Gelatinized ECTs were then maintained for 2 weeks in ECT medium containing tranexamic acid (Sigma) at 400 μm and aprotinin (Sigma) at 33 μg/ml. A subset of ECTs was externally paced with the C-pace apparatus (IonOptics) for 1 week at 2.5 Hz after an initial 1 week of culture before being harvested for functional studies. Force measurements were made in a model 801B small intact fiber test apparatus (Aurora Scientific), as described previously (25), while being perfused with Krebs-Henseleit buffer and paced externally. A stationary arm and force transducer (model 403A, Aurora Scientific), to which the ECT is attached at both ends with sutures, were controlled by a micrometer for measurement of stretch length. Twitch recordings from which contractile kinetics were measured were obtained at the length of maximum isometric force.
Protein Isolation for Western Blotting
Protein from confluent cardiomyocyte cultures was harvested by directly adding radioimmune precipitation assay buffer to each well after being washed once with PBS (no Ca2+ or Mg2+). One well/12-well plate was harvested for the measurement of cardiomyocyte purity. For protein studies only, preparations of >90% cTnT+ were used. Cells were transferred to a Microfuge tube, sonicated, and then subjected to a methanol:chloroform:water biphasic extraction (26). Protein pellets were redissolved in 5% SDS solution and stored at −80 °C until analysis. Samples were boiled in 5% β-mercaptoethanol before electrophoresis. SDS-PAGE was performed with Bio-Rad 4–15% Criterion precast gels for 42 min at 201 V, and proteins were transferred in a Criterion blotter with plate electrodes to Immobilon-FL PVDF membranes (Millipore) for 18 h at 11 V in Towbin buffer. Blotting was performed with the following primary antibodies: anti-LC3 (catalog No. NB100-2220, Novus Biologicals), LAMP1 (clone H4A3, Developmental Studies Hybridoma Bank (DSHB)), LAMP2 (clone H4B4, DSHB), p62 (catalog No. ab56416, Abcam), mono- and polyubiquitin (catalog No. BML-PW8810, clone FK2, Enzo Life Sciences), and GAPDH (catalog No. G9545, Sigma). Washes were performed in TBS with 0.05% Tween-20 (TBST) and blocking with 5% goat serum. For dystroglycan analysis, wheat germ agglutinin (WGA)-agarose beads (catalog No. AL-1023, Vector Laboratories) were incubated with iPSC-CM total protein lysates for glycoprotein enrichment. The WGA-bound glycoprotein fraction was then processed for immunodetection of α- and β- dystroglycan and laminin-binding capacity according to methods found in Hansen et al. (24).
Proteins were concentrated via biphasic extraction, separated, and transferred to PVDF as described above. The following antibodies were used to probe the glycoprotein fraction: βDG (clone 43DAG1/8D5, Abcam), anti-α-dystroglycan (αDG) (clone IIH6c4, DSHB), and anti-αDG (clone VIA4-1, DSHB). The laminin overlay assay was performed as described by Michele et al. (27) with the following reagents: Engelbreth-Holm-Swarm laminin (catalog No. L2020, Sigma) and anti-laminin (catalog No. L9393, Sigma). Secondary antibodies were all Alexa Fluor-conjugated with fluorescent signals detected with the Bio-Rad ChemiDoc system.
Two-dimensional Western Blotting
Electrophoresis in two dimensions began with the carrier ampholine method of isoelectric focusing (IEF), as described elsewhere (28, 29), within a glass tube containing 4% polyacrylamide and 2% IsoDalt Servalytes, pH 3–10 (Serva, Heidelberg, Germany), in a 9 m urea buffer. IEF was performed for 9600 V-h with WGA glycoprotein extracts from 4 million cells boiled in a 5%SDS, 5% β-ME solution and then mixed with 9 m urea/2 M thiourea at a 1:1 ratio before being applied to the acidic end of the tube. Following IEF, the tubes were equilibrated for 5 min in 10% glycerol, 50 mm DTT, 2.3% SDS and 0.0625 m Tris, pH 6.8, and then boiled for 5 min in a water bath. The tube gels were sealed on a stacking gel overlaying a 7% acrylamide separating gel. SDS-PAGE occurred for 4 h at 15 mA. The gel was then transferred to a PVDF membrane for 18 h at 22 V with a Criterion tank blotter in Towbin buffer. Western blotting was then identical to that described for the one-dimensional method.
Immunocytochemistry/Immunohistochemistry
Cardiomyocyteson glass coverslips were fixed in 10% neutral buffered formalin for 15 min at room temperature, washed with TBS, permeabilized in 20 μg/ml digitonin for 10 min, blocked in 5% goat serum, and probed with the following antibodies in addition to the ones used for immunoblotting: Golgin-97 (clone CDF4, Novex) and GM130 (clone EP892Y, Abcam). For ECT histology, the tissues were immersed in Dent's fixative overnight at 4 °C, embedded in paraffin, and sectioned at 8 μm thickness. Once on glass slides and rehydrated, the sections were stained with H&E or cTnT. All nuclei were detected with DAPI.
Electron Microscopy
Cardiomyocyte clusters were fixed in 2.5% paraformaldehyde, 3% gluteraldehyde in 0.1 m cacodylate buffer overnight at 4 °C, post-fixed in 1% osmium tetroxide, dehydrated in ethanol gradient, embedded in Durcapan (Fluka), sectioned at 60 nm, and stained with lead citrate and uranium acetate. All images were taken on a Philips CM120 transmission electron microscope.
N-Linked Glycan Identification by MALDI-TOF-MS
10 million iPSC-CMs/cell line were subjected to chloroform:methanol:water lipid extraction three times, and then the pellets were washed/precipitated with cold acetone:water three times. A weighed amount of high protein powder from each sample was digested with trypsin/chymotrypsin in Tris-HCl buffer overnight. After protease digestion, each sample was passed through a C18 Sep-Pak cartridge and washed with 5% acetic acid, and the glycopeptides were eluted with a blend of isopropanol in 5% acetic acid.
The glycopeptides were treated with PNGase F to release the N-linked glycans, and each of the digests was passed through a C18 Sep-Pak cartridge to recover the N-glycans. The N-glycan fractions were subsequently lyophilized and permethylated for structural characterization by mass spectrometry (30). Each dried eluate was dissolved with dimethyl sulfoxide and methylated with NaOH and methyl iodide. The reaction was quenched with water, and per-O-methylated carbohydrates were extracted with methylene chloride and dried under N2. The permethylated glycans were dissolved with methanol and crystallized with an α-dihyroxybenzoic acid (20 mg/ml in 50% methanol:water) matrix. Analysis of glycans present in the samples was performed in the positive ion mode by MALDI-TOF/TOF-MS using AB SCIEX TOF/TOF 5800 (Applied Biosystem/MDS Analytical Technologies). The above N-linked glycan mass spectrometry studies were performed by the Complex Carbohydrate Research Center Analytical Services at the University of Georgia, Athens, GA.
RESULTS
Reprogramming Pompe Disease Fibroblasts into iPS Cells
Skin fibroblasts from two unrelated infantile-onset Pompe patients, designated Pompe 1 and Pompe 2, were reprogrammed into iPS cells using the overexpression of a set of factors as described previously (19). In addition, skin fibroblasts from the healthy mother of the Pompe 1 patient, referred to as Control 1, were also reprogrammed. Consistent with the cells being reprogrammed to a pluripotent state, nuclear immunolabeling for the pluripotency-related transcription factor OCT4 was present as was cell surface immunolabeling for stage-specific embryonic antigen 4 (SSEA4) (Fig. 1A). The cell line karyotypes were confirmed as normal 46XX in Pompe 1 and Control 1 and 46XY in Pompe 2 (Fig. 1B). The new cell lines were tested for pluripotency using a teratoma assay in immunocompromised mice. As shown in Fig. 1C, the formation of all three embryonic germ layers occurred for each of the new iPS cell lines. The other human iPS cell line studied in this work, called Control 2, was reprogrammed previously from lung fibroblasts and characterized (31). Table 2 summarizes the source and properties of the cell lines used in this study.
FIGURE 1.
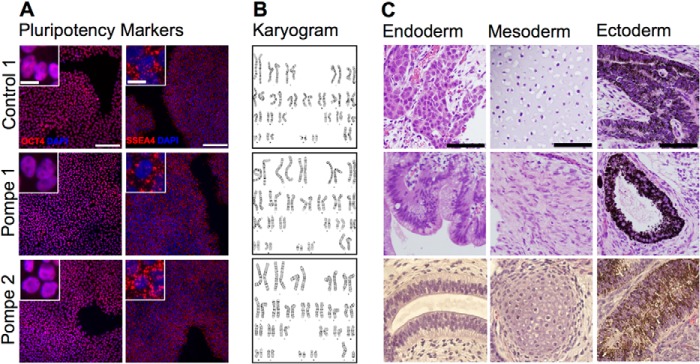
Characterization of iPS cells reprogrammed from patient dermal fibroblasts. A, immunofluorescence of iPS cell cultures probed with anti-OCT4 (nuclear) and anti-SSEA4 (plasma membrane) markers of pluripotency. Scale bar = 100 μm for panels and 10 μm for insets. B, Giemsa band karyograms from each line: Control 1, 46XX; Pompe 1, 46XX; Pompe 2, 46XY. C, H&E-stained sections of iPS cell teratomas. Examples of endoderm, mesoderm, and ectoderm are represented from each reprogrammed line. Endoderm: Control 1, hepatoid cells; Pompe 1, primitive gut epithelium; Pompe 2, respiratory epithelium. Mesoderm: Control 1, cartilage; Pompe 1, smooth muscle; Pompe 2, cartilage. Ectoderm: Control 1, Pompe 1 and Pompe 2, retinal pigmented epithelium. Scale bar = 50 μm.
TABLE 2.
iPS cell line nomenclature, GAA genotype, and phenotype
del ex18, deletion of exon 18; WT, wild type; 1441delT, deletion of a T nucleotide at GAA cDNA position 1441; 2237G→A, G to A transition at GAA cDNA position 2237.
| Official name | Common name | GAA genotype | Pompe phenotype |
|---|---|---|---|
| GM20123 | Control 1 | WT/del ex18 | Healthy |
| IMR90c4 | Control 2 | WT/WT | Healthy |
| GM20089 | Pompe 1 | del ex18/del ex18 | Infantile Pompe disease |
| GM04912 | Pompe 2 | 1441delT/2237G→A | Infantile Pompe disease |
Pompe iPS Cells Have Disease-causing Acid α-Glucosidase Mutations Resulting in Undetectable Mature Protein and Enzymatic Activity
The mutations in the GAA gene in the original Pompe fibroblasts were evaluated in the corresponding iPS cell lines. The Pompe 1 cell line has a homozygous exon 18 deletion of ∼550 bp in GAA, as demonstrated by the PCR product in Fig. 2A of the genomic DNA region surrounding exon 18. The Control 1 iPS cell line, originating from skin fibroblasts from the mother of Pompe 1, is heterozygous for the exon 18 deletion in the GAA gene. In comparison, the Control 2 iPS cell line is homozygous wild type for exon 18 of GAA.
FIGURE 2.
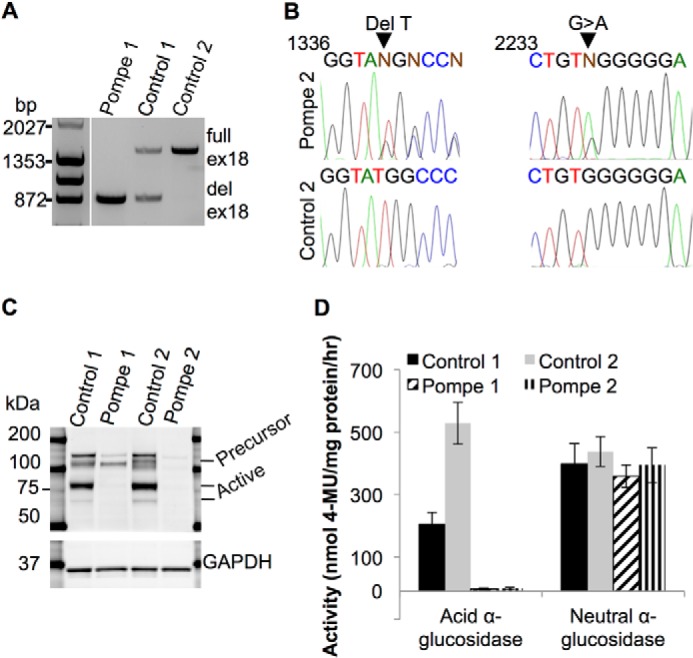
The acid α-glucosidase genotype and biochemical phenotype in Pompe and control iPS cell lines. A, PCR products of the genomic DNA region that includes GAA exon 18 from Pompe 1, Control 1, and Control 2 iPS cell lines separated on a 0.8% agarose gel. ex18, exon 18; del ex18, deletion of exon 18. B, sequencing chromatograms of PCR products from Pompe 2 iPS cell genomic DNA at locations of the two point mutations. Aligned wild-type sequences underneath are from Control 2 iPS cells. Arrows point to the deletion of a T nucleotide in one allele and the G→A transition in the other allele. Regions of interest were PCR-amplified and directly sequenced. Nucleotide position numbers refer to the GAA cDNA sequence. C, immunoblot of iPS cell total protein lysates probed with anti-GAA. The precursor form is ∼110 kDa, and enzymatically active forms are represented by a dark band above and a light band below the 75-kDa marker. Anti-GAPDH was used as a loading control. D, enzymatic activity assay of total protein lysates from the four iPS cell lines for the ability to hydrolyze 4-MUG into glucose and the fluorophore 4-MU at pH 4 for lysosomal GAA and at pH 7 for cytoplasmic neutral α-glucosidase. Activity is measured as nmol of 4-MU released/mg of protein/h. n = 4 biological replicates (cells taken from different passages) for each line. All error bars are ±S.E.
The Pompe 2 line is a null compound heterozygote at the GAA locus with one allele containing a deletion of a T nucleotide at cDNA position 1441 (Fig. 2B), resulting in a frameshift and a premature stop codon 39 amino acids downstream. The other allele has a G to A transition at position 2237 (Fig. 2B), producing a UAG stop codon at that location. For comparison, the wild-type sequence from Control 2 genomic DNA are shown.
To test the impact of the Pompe mutations on the expression of GAA protein, Western blotting of iPS cell protein lysates with an anti-GAA antibody revealed the active lysosomal 70- and 76-kDa forms of GAA in control but not Pompe lines (Fig. 2C). No significant immunoreactivity for GAA was found from the Pompe 2 sample, but the Pompe 1 sample demonstrated the GAA precursor around a molecular mass of 110 kDa like the controls (32). This is consistent with a previous report that the deletion of exon 18 allows for a precursor peptide to be translated but not processed into an active form (33).
To ascertain whether the mutations in the Pompe cell lines affects GAA function, protein lysates from iPS cells were assayed for GAA activity via incubation with the substrate 4-MUG at pH 4. Hydrolysis of this substrate releases the fluorophore 4-MU and free glucose. Both Pompe lines had no detectable GAA activity compared with the control lines, which demonstrated activity in the expected range (Fig. 2D). The GAA activity of Control 1 was approximately ½ that of Control 2, suggesting a gene dosage effect because Control 1 has one functional GAA allele, whereas Control 2 has both copies active. As an assay control, 4-MUG was incubated at pH 7 to measure neutral-α-glucosidase activity. Equivalent neutral-α-glucosidase activity was measured in all lines, confirming that the catalytic deficit in Pompe disease is due to the hydrolysis of the α1–4 glucosidic bond at the typical acidic pH of the lysosome.
Pompe iPSC-derived Cardiomyocytes Have Pathognomonic Glycogen-filled Lysosomes
A feature found in striated muscle from patients with Pompe disease is lysosomal glycogen accumulation (34). We examined the ultrastructure of control and Pompe iPSC-CMs under standard culture conditions by using electron microscopy. The cytoplasm of both Pompe and control iPSC-CMs revealed abundant glycogen β-particles in Fig. 3A, a feature found in embryonic cardiomyocytes (35). To differentiate lysosomal from cytoplasmic glycogen, the iPSC-CMs were cultured in medium without glucose overnight. Ultrastructure of control iPSC-CMs deprived of glucose (Fig. 3B) shows a disappearance of glycogen β-particles. The Pompe iPSC-CMs also have a depleted cytoplasmic glycogen pool; however, glycogen β-particles remain in membrane-isolated structures (Fig. 3, B and C). In contrast, lysosomes from Control 1 iPSC-CMs are identified with electron dense material without evident glycogen. Likewise, the Control 2 and Pompe 2 iPSC-CMs showed a comparable distinction in lysosomal glycogen accumulation (data not shown).
FIGURE 3.
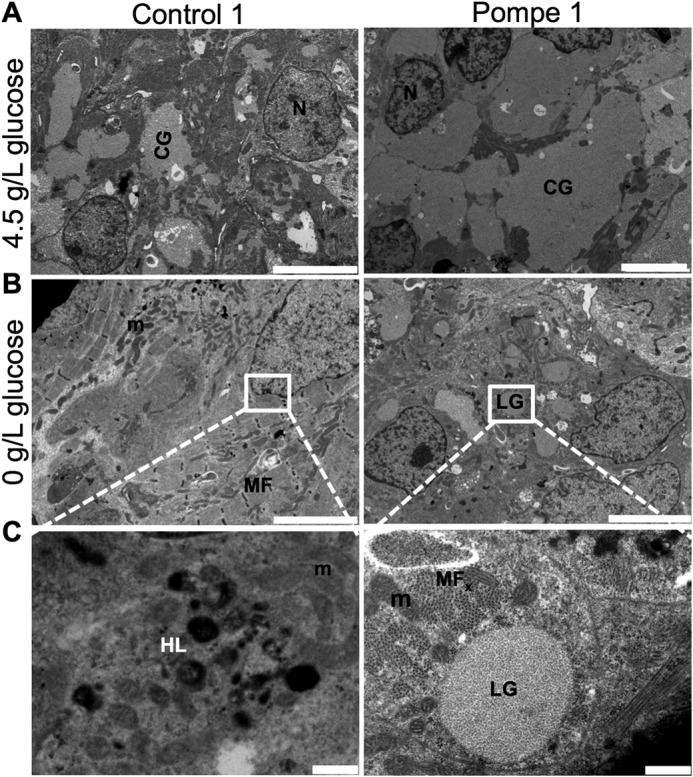
Ultrastructure of Pompe and control iPSC-CMs. A, electron micrographs of Control 1 and Pompe 1 iPSC-CMs cultured in media containing 4.5 g/liter glucose. Scale bar = 5 μm B, electron micrographs of Control 1 and Pompe 1 iPSC-CMs cultured in zero g/liter glucose for 24 h before imaging. Scale bar = 5 μm C, expanded regions from B. scale bar = 0.5 μm. N, nuclei; CG, cytoplasmic glycogen; M, mitochondria; HL, healthy lysosome; LG, lysosomal glycogen; MF, myofilaments; MFx, myofilaments in cross-section.
Contractile Function of Engineered Cardiac Tissue Produced with Control and Pompe iPSC-CMs
Given the limited understanding of cardiac contractile function in Pompe disease in the setting of profound cardiac hypertrophy, we produced ECT with iPSC-CMs to assess contractile performance. After 2 weeks of culture, the ECTs remodeled into linear strips of spontaneously contracting tissue (Fig. 4A and supplemental Movie 1) that were cellularized (Fig. 4B) with cardiomyocytes located circumferentially as visualized with cTnT immunofluorescence (Fig. 4C). Electron micrographs of control and Pompe ECTs displayed elongated nuclei and longitudinally oriented myofilaments (Fig. 4, D and E). However, only in the Pompe ECT were glycogen-filled lysosomes evident.
FIGURE 4.

Structural characterization of ECTs produced with control and Pompe iPSC-CMs. A, photograph of an ECT in perfusion chamber before testing. The left end is tied to a stationary arm, and the right end will soon be attached to the force transducer. Scale bar = 1 mm. B, photomicrograph of an H&E-stained longitudinal ECT section post-testing. Scale bar = 50 μm C, immunofluorescence image of a sectioned ECT immunolabeled with anti-cTnT to identify cardiomyocyte location. Scale bar = 50 μm. DAPI stains the nuclei blue. D, representative electron micrographs of a control ECT. Scale bar = 5 μm E, an electron micrograph of a Pompe ECT. N, nuclei; MF, myofilaments; LG, lysosomal glycogen. Scale bar = 5 μm.
ECTs were stimulated at 2.5 Hz, and isometric force generation was measured. Pompe 1 ECTs demonstrated significantly accelerated kinetics of contraction compared with the other lines tested (Fig. 5A and Table 3). However, we noted differences in the intrinsic rates at which the ECTs contracted during the 2 weeks of culture during ECT maturation. Pompe 1 ECTs had an intrinsic rate (2.2 Hz) that was at least double the intrinsic rate of the other lines studied (Table 3). Therefore, we conducted another series of experiments in which all ECTs were conditioned by pacing at 2.5 Hz for 1 week in culture prior to force measurements to provide a uniform rate of contraction. Pacing for 1 week accelerated the contraction kinetics for the three lines that had slower intrinsic rates to a greater extent than for Pompe 1 ECTs, which had a fast intrinsic rate (Fig. 5B). For the conditioned ECTs, the normalized force (F/Fmax) and the first derivative (dF/dt/Fmax) versus time relationships (Table 3) showed no consistent differences between ECTs prepared from the two control and two Pompe cell lines (Fig. 5, C and D, and Table 3).
FIGURE 5.

Contractile force and kinetic studies of ECTs produced with control and Pompe iPSC-CMs. A, force normalized to maximum force (F/Fmax) versus time curves for a single contraction at 2.5 Hz from ECTs contracting at their intrinsic rate (unpaced) while in culture for 2 weeks prior to testing. 30 contractions are averaged for each ECT. B, the F/Fmax versus time curves measured at 2.5 Hz for both control and Pompe ECTs either allowed to contract at their intrinsic rate for 2 weeks in culture or paced at 2.5 Hz for 1 week before measurement. The N (number of ECTs tested) for each cell line in both paced and intrinsic rate groups are given in Table 3. C, F/Fmax versus time curves for a single contraction at 2.5 Hz from ECTs that were paced in culture for 1 week at 2.5 Hz. D, first derivative (dF/dt, dt = 0.001s) of the F/Fmax versus time curves in C. All error bars are ±S.E.
TABLE 3.
Comparison of kinetic parameters and maximum force
Kinetic parameters and maximum force were measured at a pacing frequency of 2.5 Hz between ECTs contracting at their unpaced rate or paced at 2.5 Hz for 1 week prior to testing. Time to peak, time from external pacing voltage initiating the contraction to peak force generation. Time to 50% force relaxation, time from maximum force to 50% maximum force during relaxation. N refers to the number of ECTs tested for each group. Force is reported in millinewtons (mN). Errors are ±S.E.
| ECT I.D. | Unpaced rate (N) | Paced rate (N) | Unpaced time to peaka | Paced time to peakb | Unpaced time to 50% relaxationc | Paced time to 50% relaxationd | Unpaced peak forcee | Paced peak forcef |
|---|---|---|---|---|---|---|---|---|
| Hz | Hz | ms | ms | ms | ms | mN | mN | |
| C1 | 1.1 ± 0.2 (34) | 2.5 (24) | 185 ± 4 | 175 ± 4g | 107 ± 2 | 99 ± 2g | 1.2 ± 0.1 | 1.1 ± 0.1 |
| C2 | 0.8 ± 0.2 (14) | 2.5 (9) | 187 ± 5 | 166 ± 3g | 121 ± 3 | 98 ± 2g | 0.9 ± 0.2 | 0.9 ± 0.1 |
| P1 | 2.2 ± 0.3 (26) | 2.5 (14) | 164 ± 4 | 157 ± 3 | 95 ± 2 | 90 ± 2 | 0.9 ± 0.1 | 0.4 ± 0.1g |
| P2 | 0.6 ± 0.2 (24) | 2.5 (11) | 195 ± 5 | 173 ± 8g | 111 ± 2 | 106 ± 3 | 1.5 ± 0.2 | 1.0 ± 0.3 |
a P1 is significantly different from all other values (p < 0.05, ANOVA). The Bonferroni post hoc correction method was used following ANOVA.
b No significant differences were noticed between all comparisons (ANOVA).
c Significant differences were found in all comparisons except between the C1,P2 pairing (p < 0.05, ANOVA).
d Significant differences were only found between the P1,P2 and P1,C1 pairings (p < 0.05, ANOVA).
e P1 is significantly different from P2 (p < 0.05, ANOVA).
f P1 is significantly different from C1 (p < 0.05, ANOVA).
g Paced value is significantly different from unpaced value (p < 0.05, unpaired t test with unequal variance).
Macro-autophagic Function Is Preserved in Pompe iPSC-CMs
Recent studies in Pompe skeletal muscle have implicated impaired autophagic flux as a major contributor to the pathogenesis of myofiber destruction (8). However, the role of autophagic dysfunction in the myocardium of infantile-onset Pompe patients is unknown (14). To examine autophagosomal turnover in the Pompe iPSC-CM model, we forced autophagosome accumulation by blocking lysosomal acidification with chloroquine (CQ). Removal of CQ from the media re-establishes lysosomal function and autophagosomal clearance (36). To detect the autophagosomal system, we examined the microtubule-associated protein light chain 3 (LC3), which is synthesized in a soluble cytoplasmic form (LC3-I) and, upon induction of autophagy, becomes lipidated and anchors in the autophagosome membrane as LC3-II. Immunofluorescence studies demonstrate LC3 fluorescence on day 0 (D0) is diffuse through the cytoplasm, highlighting the LC3-I form. However, following CQ exposure the fluorescence becomes more intense and punctate, representing conversion to the membrane localized LC3-II form (Fig. 6A). These results demonstrate that treatment with CQ cause autophagosomal accumulation in the iPSC-CMs.
FIGURE 6.

Autophagosomal flux in control and Pompe iPSC-CMs during recovery from CQ-mediated lysosomal arrest. A, immunofluorescence image of LC3 in control and Pompe iPSC-CMs before and after 2 days of CQ treatment. DAPI stains the nuclei blue. Scale bar = 10 μm. B, LC3 immunoblots of total protein lysates during CQ treatment and recovery with GAPDH controls. LC3-I is converted into LC3-II upon autophagosomal formation. Three replicate experiments (CMs differentiated from different iPS cell passages) are shown for each line, with one lane representing cells from one culture well. D0, day 0. Cells were harvested immediately before CQ treatment. CQ, cells exposed to CQ for 2 days before protein collection. R1, R4, and R8, recovery from CQ treatment. CQ was removed from the media, and cells were cultured for 1, 4, and 8 days in normal media before harvest. The x axis is labeled to correspond with immunoblot time points. C, quantification of LC3-II/GADPH density ratios from B relative to the maximum ratio set to 1. Each x axis mark represents 1 day, with the black bar indicating CQ exposure. D, immunoblots of p62 and total ubquitinylated protein (mono- and poly-) from Control 1 and 2 and Pompe 1 and 2 iPSC-CM total protein. E, quantification of p62 and conjugated ubiquitin (Conj-Ub) to GAPDH density ratios. Density ratios were averaged from four independent control (two C1 + two C2) and Pompe (two P1 + two P2) samples on two separate blots. All error bars are ±S.E.
Western blots with anti-LC3 were evaluated for iPSC-CMs during CQ treatment and recovery along with anti-GAPDH loading controls (Fig. 6B). Densitometric ratios of LC3-II/GAPDH show that all lines experienced a rise in LC3-II following 48 h of 20 μm CQ treatment (Fig. 6C); the rise was between 15- and 20-fold above baseline ratios. At day 1 of recovery (R1), all lines showed a decline in LC3-II, except for Pompe 2 iPSC-CMs, which consistently demonstrated a rise in LC3-II at R1. By 8 days of recovery (R8), all control and Pompe iPSC-CMs were able to reduce their LC3-II burden toward baseline (D0) levels. Therefore, a CQ-based autophagic challenge did not reveal persistent autophagosomal (LC3-II) accumulation or a slower autophagic flux in Pompe iPSC-CMs compared with the control iPSC-CMs. Secondary markers of autophagic dysfunction, such as the autophagy adaptor protein p62 and polyubiquitinated proteins, were not significantly different in Pompe versus control iPSC-CMs (Fig. 6, D and E).
The lysosomal system also changes dramatically when exposed to CQ, as visualized in Fig. 7A with anti-LAMP1 (37). Before CQ treatment, LAMP1 labeling is punctate in control iPSC-CMs but outlines larger lysosomal structures in Pompe cells. In response to CQ, both Pompe and control cells experience an expansion of the lysosomal population both in quantity and/or size.
FIGURE 7.
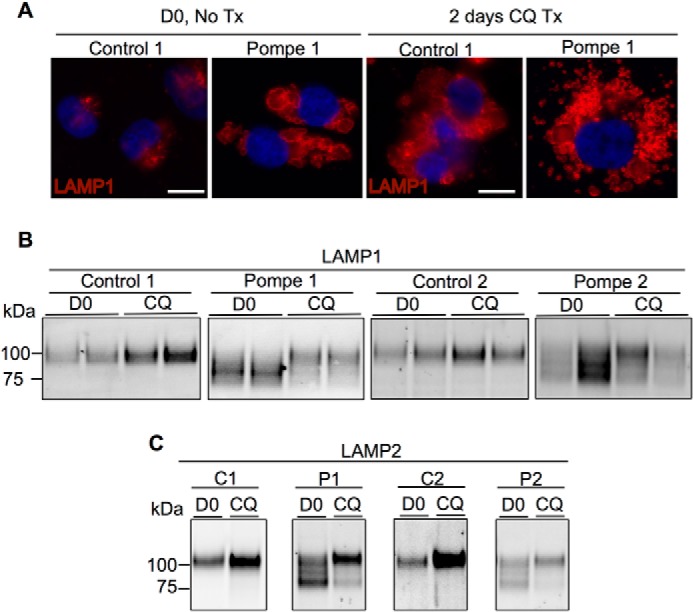
Analysis of LAMPs from control and Pompe iPSC-CMs before and after CQ treatment. A, LAMP1 immunofluorescence in control and Pompe iPSC-CMs before (D0) and after 2 days of CQ treatment (Tx). DAPI stains the nuclei blue. Scale bar = 10 μm. B, LAMP1 immunoblots from Pompe and control iPSC-CMs before and after 2 days of CQ treatment. Data are presented in duplicates. C, LAMP2 immunoblots from Pompe and control iPSC-CMs before and after 2 days of CQ exposure.
The LAMP1 immunoblots in Fig. 7B show an increase in intensity following CQ treatment for the control iPSC-CMs, but in the Pompe iPSC-CMs an unexpected change in electrophoretic mobility of LAMP1 was observed. LAMP1-SDS complexes from control cells have an apparent molecular mass of 100 kDa, whereas LAMP1 in the Pompe lines present as a smear with prominent bands below 100 kDa. Following CQ treatment, the intensity of the lower mobility LAMP1 band in the Pompe lines increased concomitant with diminishing amounts of the higher mobility forms. The mobility of LAMP1 in the control lines remains the same upon CQ exposure. We also investigated the immunoblotting patterns of LAMP2 (Fig. 7C), which co-exists with LAMP1 as a glycoprotein on the lysosomal membrane. Like LAMP1, LAMP2 presents as a single band in the control lines but as multiple bands of higher mobility in the Pompe lines. Also like LAMP1, control lines experience an increase in LAMP2 intensity with no change in mobility as a result of CQ exposure, whereas Pompe cells demonstrate a reduction in LAMP2-SDS complex mobility in response to CQ.
Lysosomal Membrane Proteins Are Hypoglycosylated in Pompe iPSC-CMs
We decided to investigate the cause for the differences in mobility of the LAMPs in the Pompe iPSC-CMs by focusing on glycosylation, as both of these proteins are heavily glycosylated by traditional N- and O-linked endoplasmic reticulum (ER)-to-Golgi glycan biosynthesis pathways. In addition, several of the N-linked adducts are modified by long poly-N-acetyllactosamines added in the Golgi apparatus (38–41). To test the hypothesis that a deficit in Golgi-based glycosylation is the source of lower molecular weight LAMP species, iPSC-CMs were exposed to brefeldin A (BFA), a fungal metabolite that causes collapse of the Golgi stacks, disrupting Golgi-based glycosylation (42). Immunolabeling of control and Pompe iPSC-CMs for the cis-Golgi marker, GM130, and trans-Golgi, marker Golgin-97 (Fig. 8A), confirmed that BFA treatment dismantled the Golgi stack cis-to-trans orientation moving outwards from the nucleus. As a result of Golgi disruption, control iPSC-CMs harbored the higher mobility forms of LAMP1 and LAMP2 normally present in the Pompe group (Fig. 8B). Similarly, the Pompe iPSC-CMs treated with BFA showed an increase in the intensity of the higher mobility LAMPs at the cost of the lower mobility species. Therefore, we were able to reproduce in the control lines the immunoblotting pattern of the LAMPs unique to the Pompe lines by interfering with the ability of the control iPSC-CM Golgi to glycosylate proteins. Moreover, the Pompe disease-specific LAMP patterns were exaggerated in the Pompe iPSC-CMs through Golgi disruption.
FIGURE 8.
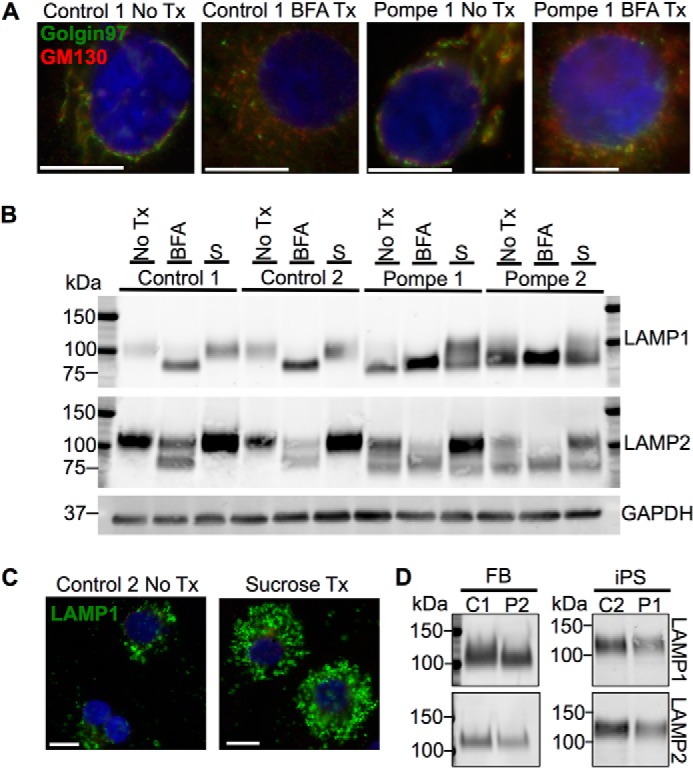
Effect of Golgi structural disruption and induction of an artificial lysosomal storage disorder on LAMP1 and LAMP2 from control and Pompe iPSC-CMs. A, the Golgi apparatus stained with cis- and trans-Golgi marker GM130 and Golgin-97, respectively, in control and Pompe iPSC-CMs and after treatment (Tx) with BFA. Scale bars = 10 μm. B, immunoblots of LAMP1 and LAMP2 from iPSC-CMs with no treatments (No Tx), after 2 days of 500 ng/ml BFA treatment and after 2 weeks of culture in 100 mm sucrose (S). GAPDH functions as the loading control. C, lysosomes stained with LAMP1 before and after 2 weeks of sucrose treatment in Control 2 iPSC-CMs. Scale bar = 10 μm. All nuclei are stained with DAPI in blue. D, representative LAMP1 and LAMP2 immunodetection from skin fibroblast (FB) and iPS cell total protein lysates.
As Pompe iPSC-CMs had no overt Golgi structural pathology, we next tested whether the hypoglycosylation of the LAMPs was a general response to lysosomal expansion or specific to lysosomal glycogen accumulation occurring in Pompe disease. We cultured the iPSC-CMs in 100 mm sucrose to induce a “sucrosome” storage disorder (43). In high sucrose concentrations, cells lacking invertase activity gradually accumulate cytoplasmic sucrose, which enters the endosomal/autophagic system and is ultimately trapped in the lysosome. Control 2 iPSC-CMs demonstrated lysosomal expansion marked by LAMP1 due to sucrose uptake (Fig. 8C). However, immunoblot detection of LAMP1 and LAMP2 following sucrose culture (Fig. 8B) revealed no changes in species mobility in the Control 1 and Control 2 iPSC-CMs, suggesting that the higher mobility of LAMPs from Pompe cells is not due to lysosomal accumulation of a nonmetabolizable carbohydrate. Sucrose treatment did increase the lower mobility LAMP1 and LAMP2 band intensities in the Pompe lines, indicating that the new LAMPs being synthesized were undergoing correct Golgi glycosylation.
In contrast to the different mobilities of LAMP1 and LAMP2 in Pompe and control iPSC-CMs, no differences in LAMP mobilities were observed in the original skin fibroblasts or undifferentiated iPS cells (Fig. 8D). The cell type dependence of LAMP hypoglycosylation has implications for understanding the tissue-specific manifestation of Pompe disease pathology.
To further characterize the deficit of glycosylation, protein lysates were tested for endoglycosidase sensitivity. Treatment of lysates from iPSC-CMs with endoglycosidase F (Endo F), which cleaves all N-linked glycans at their asparagine, produces a de-N-glycosylated LAMP2 of equal molecular weight in Pompe and control cells (Fig. 9A). Protein lysates were also subject to endoglycosidase H (Endo H) treatment to determine the extent of Golgi-glycan processing. Endo H only cleaves N-glycans if they have not been acted upon by the Golgi enzyme α-mannosidase II (αManII), the committing reaction to downstream complex N-linked glycan synthesis (44). Control 2 and Pompe 2 lines showed a subtle increase in LAMP2 mobility upon Endo H treatment, implying that a subpopulation of N-linked glycans is not processed by αManII (Fig. 9A). Similar Endo H sensitivity between Control 2 and Pompe 2 LAMP2 suggests the deficit in Golgi processing is not from lack of entry into the Golgi or the inaction of Golgi mannosidases but by reduced Golgi-glycotransferase activity, responsible for post-αManII complex glycan extension. The results from LAMP1 endoglycosidase treatment and from the Control 1 and Pompe 1 lines were the same.
FIGURE 9.

Glycosylation analysis of LAMP2 from control and Pompe iPSC-CMs via endoglycosidase treatment and two-dimensional glycoprotein separation. A, endoglycosidase analysis of LAMP2 in Control 2 and Pompe 2 iPSC-CMs. Endo F cleaves all N-linked glycan chains, producing a de-N-glycosylated peptide. Endo H cleaves N-linked glycan chains that have not yet been processed by the α-mannosidase II class of Golgi glycosidases. B, Western blots demonstrating LAMP2 enrichment from total iPSC-CM protein by WGA glycoprotein pulldown. LAMP2 was immunodetected from equal amounts of Control 2 and Pompe 2 total cellular protein (input) and WGA-bound glycoprotein (wga). C, Western blot showing efficiency of LAMP2 extraction by WGA from Control 1 iPSC-CM total protein lysate. LAMP2 and GAPDH were immunodetected in the WGA-bound fraction and the WGA-unbound (flow-through (FT)) fraction. D, WGA-bound glycoprotein extracts from Control 1 and 2 and Pompe 1 and 2 iPSC-CMs separated by pI and molecular weight along the horizontal and vertical axes, respectively, and probed for LAMP2. The pH gradient across the IEF tube was measured by using a surface pH electrode for three blank IEF tubes. Also included are sialidase-treated Control 1 and Pompe 1 glycoprotein prior to two-dimensional separation and immunodetection of LAMP2. *, indicates likely background detection.
The LAMPs have a significant number of sialic acid sugars added in the Golgi (45). We hypothesized that incomplete Golgi-based glycosylation in Pompe iPSC-CMs that affects the apparent molecular weight would also change the pI due to incomplete addition of charged sugars such as the sialic acids. To evaluate for this possibility, we performed IEF in two-dimensional PAGE followed by immunodetection of LAMP2.
Enrichment of glycoproteins via WGA pulldown was necessary to immunodetect the LAMPs following two-dimensional separation and membrane transfer. The WGA method increased the amount of LAMP2-to-total protein ratio and captured the higher mobility species observed in Pompe iPSC-CMs (Fig. 9B). The flow-through contained an undetectable amount of LAMP2 (Fig. 9C). Therefore, data from the two-dimensional blots were not confounded by the purification method employed.
Isoelectric separation revealed LAMP2 detection at pH 4.6 from Control 1 and 2 cells, at pH 5.6 from the Pompe 1 cells and as a distribution between pH 5.0 and 6.4 in Pompe 2 cells (Fig. 9D). Treatment of WGA-enriched glycoprotein with sialidase, an exoglycosidase with specificity for terminal sialic acid carbohydrates, produced an alkaline pI shift in Control 1 LAMP2 to pH 5.3–6.1 but had little to no effect on the pI of Pompe 1 LAMP2 (Fig. 9D). Therefore, the pI studies are consistent with a reduction in the amount of acidic sugar (sialic acid) added to LAMP2 in Pompe iPSC-CMs.
Pompe iPSC-CMs Have a Global Deficiency in N-Linked Glycan Synthesis
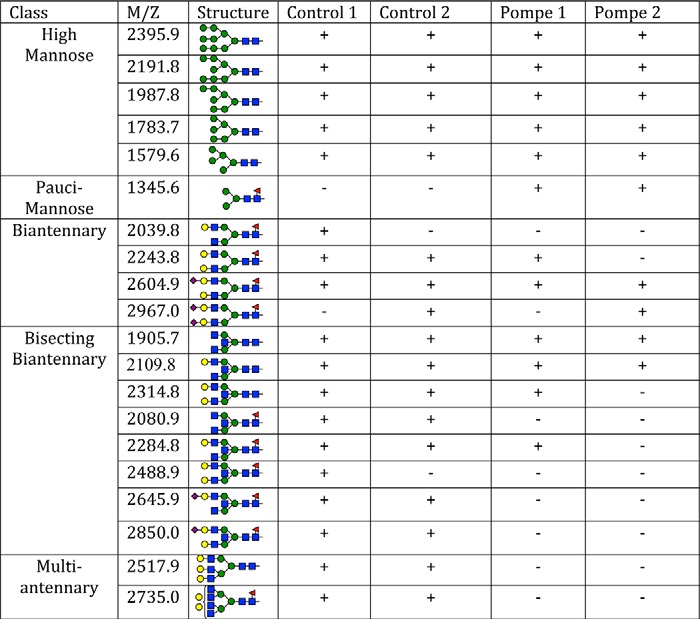
For an assessment of total N-linked glycans, MALDI-TOF-MS was performed on purified N-linked glycans released by Endo F treatment of 10 million control or Pompe iPSC-CMs per sample. Mass spectra of Control 1 and Pompe 1 (Fig. 10) and Control 2 and Pompe 2 (Fig. 11) N-linked glycans demonstrate the presence of all high mannose structures in all cell lines (Table 4). A major peak at m/z = 1345.6 corresponding to a fucosylated chitobiose trimannose structure (Fuc)(NacGln)2(Man)3 was present exclusively in the Pompe spectra (Figs. 10B and 11B). All complex-type N-linked glycans have a trimannose core produced by the αManII/IIx class of Golgi glycosidases before branching and extension into complex glycans (46). The unmodified trimannose core was not detected in the control spectra (Figs. 10A and 11A). Both Pompe and control cells have biantennary structures with N-acetylglucosamine, galactose, and sialic acids. However, Pompe cells are deficient in the higher complexity bisecting biantennary and multiantennary glycans (Table 4).
FIGURE 10.

Mass spectra of N-linked glycans from Control 1 and Pompe 1 iPSC-CMs. Mass spectra obtained from MALDI-TOF-MS of N-linked glycans from Control 1 (A) and Pompe 1 (B) iPSC-CMs. Equal (weighed) amounts of total cellular protein per sample were processed for N-linked glycan extraction, permethylation, and mass/charge determination. Individual peaks and background intensities are calibrated to the maximal intense peak of the sample. Regions that contain peaks of relatively low intensity have been presented at ×4 magnification above the region without magnification.
FIGURE 11.

Mass spectra of N-linked glycans from Control 2 and Pompe 2 iPSC-CMs. Mass spectra obtained from MALDI-TOF-MS of N-linked glycans from Control 2 (A) and Pompe 2 (B) iPSC-CMs. See Fig. 10 legend for description.
TABLE 4.
Structures of N-linked glycans from Pompe and control iPSC-CMs identified by MALDI-TOF-MS
The mass/charge (M+H+) of permethylated glycans were matched to the permethylated molecular weights of the formula (Hex)n(HexNac)n(DeoxyHex)n(NeuAc)n, where Hex = hexose, Nac = N-acetyl, and NeuAc = neuraminic acids (sialic acids). Structural formulas were assigned based on known N-linked glycan structures for a given molecular formula. The glycans are arranged from top to bottom based on the complexity of Golgi processing, from the simplest glycans of the high mannose variety at the top to the tri- and tetra-antennary structures at the bottom. Blue square, N-acetyl-glucosamine; green circle, mannose; yellow circle, galactose; red triangle, fucose; purple diamond, sialic acid.
Golgi-based Glycosylation and Laminin Binding Capability of α-Dystroglycan Is Preserved in Pompe iPSC-CMs
From the finding that the deficit of Pompe LAMP glycosylation was in the Golgi, we hypothesized that αDG is also hypoglycosylated in Pompe iPSC-CMs, because αDG undergoes O-linked glycosylation via the like-acetylglucosaminyltransferase (LARGE) located in the Golgi (47). The disaccharide polymer (xylose-glucuronic acid)n added by LARGE, functions as the binding domain for laminin and if lacking causes a class of muscular dystrophies called the dystroglycanopathies (27, 48, 49). Since Pompe disease shares a similar clinical presentation with dystroglycanopathies (50), we tested the hypothesis that a loss of laminin binding by αDG contributes to Pompe cardiomyopathy.
Antibody clones IIH6c4 and VIA4-1, which recognize only the LARGE processed form of αDG (51, 52), were used in quantitative immunoblot assays of WGA-enriched glycoprotein extracts from Pompe and control iPSC-CMs. The glycosylated αDG (VIA4-1 and IIH6c4) to βDG band density ratios were the same in Pompe and control iPSC-CMs (Fig. 12, A and C), arguing against a deficit of αDG glycosylation. To confirm that glycosylated αDG in Pompe iPSC-CMs was functionally able to bind laminin, we performed a laminin overlay assay. Both control and Pompe iPSC-CMs exhibited comparable αDG-specific laminin binding (Fig. 12, B and C). In addition, following 2 days of culture in laminin-containing medium, both control and Pompe iPSC-CMs showed a dramatic increase in surface laminin fluorescence (Fig. 12, D and E). The co-localization of IIH6c4 and laminin fluorescence is in support of αDG-mediated laminin binding (53, 54).
FIGURE 12.

Dystroglycan glycosylation and laminin binding in control and Pompe iPSC-CMs. A, immunoblots of glycoprotein from both control (C1 and C2) and Pompe (P1 and P2) iPSC-CMs probed with anti-αDG antibodies IIH6c4 and VIA4-1 that exclusively detect the laminin-binding glycoepitope. Each lane within one cell line represents protein from iPSC-CMs differentiated from different iPS cell passages. B, laminin overlay assay to measure laminin binding ability specific to αDG. Binding of laminin occurs at the molecular weight of αDG recognized by IIH6c4 and VIA4-1. C, quantification of α/β dystroglycan ratios in A and laminin binding to βDG ratios in D. No significant differences were noticed between the control and Pompe groups. D and E, laminin and αDG (IIH6c4) immunofluorescence of iPSC-CMs fixed after 2 days of incubation with exogenous laminin (bottom row) compared with normal culture conditions (top row) in Control 2 (D) and Pompe 2 (E) iPSC-CMs. Scale bar = 20 μm. All nuclei are stained with DAPI in blue.
DISCUSSION
This study establishes an iPSC-CM model of infantile-onset Pompe cardiomyopathy that manifests pathognomonic features: undetectable GAA activity and the presence of glycogen-filled lysosomes. Characterization of the Pompe iPSC-CMs did not reveal clear abnormalities in contractile function or the autophagic process. However, we unexpectedly found changes in the electrophoretic mobility of LAMPs in Pompe compared with controls iPSC-CMs. These changes were attributable to Golgi-based hypoglycosylation of the LAMPs, which typically include poly-N-acetyllactosamine and sialic acid. This study unmasks a previously unknown abnormality in protein processing in Pompe iPSC-CMs with features of hypoglycosylation similar to other congenital disorders of glycosylation (CDG) that also manifest hypertrophic cardiomyopathy (17, 55–57).
Patients with Pompe cardiomyopathy present with marked cardiac hypertrophy, which is occasionally diagnosed in utero. Echocardiography studies have demonstrated that systolic function is preserved despite profound hypertrophy for the first 5–6 months of life (2, 5), but diastolic function (relaxation) of the heart is impaired (58). By generating ECTs from iPSC-CMs, we sought to examine the early Pompe cardiomyopathy. Once we controlled for intrinsic rate by pacing all constructs at a fixed rate of 2.5 Hz for 1 week, no clear differences in contractile performance between the two control lines and two Pompe lines were observed. The fact that we did not find delayed relaxation in the Pompe ECTs as seen clinically may indicate that those changes are secondary to macroscopic remodeling of the heart rather than being intrinsic to the cardiomyocytes. The lack of significant contractile abnormalities suggests that contractile dysfunction is less likely to be the primary stimulus of the hypertrophic phenotype in Pompe cardiomyopathy.
Autophagic dysfunction has been recognized as an important feature in human Pompe skeletal myopathy (9). Elevation of the autophagosmal marker LC3-II in Pompe iPSC-CMs was not observed under standard culture conditions or after a CQ-induced autophagic challenge. The auxiliary markers of insufficient autophagy, p62 and conjugated ubiquitin, were also not elevated in Pompe iPSC-CMs. Thus, results from our model argue that autophagic dysfunction is not central to the early Pompe cardiomyopathy in humans. The Pompe mouse model also lacks autophagosomal accumulation in heart tissue (59) despite it being observed in skeletal muscle.
Abnormalities in glycosylation of LAMPs in Pompe iPSC-CMs were suggested by higher mobility LAMP species on immunoblots. In Western blots of Pompe mouse heart tissue, LAMP2 presented with higher mobility forms not detected in control hearts (60). Other CDGs have also been identified by variations in SDS complex mobility of LAMP2. For example, hypoglycosylated LAMP2 has been observed in Cohen syndrome, which is caused by mutations in a protein necessary for normal Golgi structure (61). In CDGs caused by mutations in the conserved oligomeric Golgi (COG) complex (62) or TMEM165 (63), loss of Golgi organization has been associated with LAMP2 hypoglycosylation.
Hyposialylation is a common, diagnostic feature of CDG (64–66). The LAMPs undergo extensive sialyation; 36.4 and 23.6 mol of sialic acid are added per mol of LAMP1 or LAMP2, respectively (38). The higher pI values and limited sialidase sensitivity of LAMP2 in Pompe iPSC-CMs compared with controls are consistent with a deficiency of sialic acid modification.
A key similarity among many of the CDGs is either a disruption of Golgi structure or the loss of a glycoprocessing protein activity (67, 68). In our work, we did not identify any obvious disruption in Golgi stack structure, nor does GAA have a known role in protein glycosylation. We speculated that a link between insufficient GAA activity and hypoglycosylation is secondary to the changes in glycogen metabolism. A recent publication using a mouse model of Pompe disease demonstrates dramatically increased activity of glycogen synthase concomitant with reduced glycogen phosphorylase activity, particularly in the heart (69). Because both glycogen synthesis and the nucleotide sugar synthesis pathways use UTP and glucose 6-phosphate as substrates, these reactants may be disproportionately consumed in glycogen synthesis, resulting in limited nucleotide sugar concentrations for Golgi glycotransferase reactions. Based on this reasoning, the ability for the acidotrope CQ to reverse the hypoglycosylation could arise from the neutralization of the cis-to-trans-Golgi pH gradient, thereby slowing transport of proteins through the Golgi (70) giving the LAMPs more time to be glycosylated in the environment of low substrate concentrations (40). Our finding that lysosomal sucrose accumulation had no effect on LAMP mobility in control iPSC-CMs is also supportive of glycogen accumulation being essential to the observed hypoglycosylation. In addition, Glycogen storage disease, GSD type 1b, has also been identified as a CDG (71), giving precedence to a relationship between abnormal glycogen metabolism in a glycogen storage disorder and deficits in Golgi glycosylation (72).
Limited nucleotide sugar concentrations in the Pompe iPSC-CM Golgi could also explain the mass spectrometry results. The enzymes N-acetylglucosaminyltransferase II, III, and V are required to make bi, bisecting bi-, and multiantennary N-linked glycans, respectively. The Km value for their common substrate, UDP-N-acetylglucosamine (GlnNAc), is 18 μm (73), 420 μm (74), and 4 mm (75) for N-acetylglucosaminyltransferase II, III, and V, respectively. Therefore, the equal presence of biantennary structures in Pompe and control iPSC-CMs, but limited bisecting biantennary and absent multiantennary structures in Pompe cells, may be caused by the increasing UDP-GlnNAc concentration dependence for the necessary N-acetylglucosaminyltransferase activity.
The tri and tetra-antennary structures are the preferred substrates for poly-N-acetyllactosamine extensions (76), which are abundant on the LAMPs. Previous pulse-chase experiments (38) demonstrate that the addition of lactosaminoglycans was responsible for an ≈25-kDa rise in LAMP molecular mass as a result of Golgi processing. Therefore, the 25-kDa molecular mass range for LAMPs from Pompe cells may be due to a variable lack of lactosaminoglycan extension. The absence of these extensions may originate from a deficiency in early glycan branching.
The fucosylated chitobiose trimannose glycan detected as a major peak in the Pompe mass spectra suggests that N-linked glycans are prepared for glycan branching and extension by an αManII/IIx-type glycosidase (46); however, these glycans do not experience further processing. There is debate as to whether the unmodified trimannose core can be produced by αManII/IIx (77). However, (Fuc)1(NacGln)2(Man)3 at m/z = 1345.6 has been observed in MALDI-TOF from other cells of mammalian origin (78). Whether the trimannose glycan is an indication of deficient complex glycan synthesis or a purposeful final product requires investigation.
Given the known pathology of hypoglycosylated αDG resulting in a loss of laminin binding in a subset of muscular dystrophies, which can have associated cardiomyopathies (79, 80), we examined the glycosylation of αDG specifically. We did not detect differences in αDG glycosylation or laminin binding between Pompe and control iPSC-CMs, suggesting that this specific glycosylation pathway is intact in Pompe disease and unlikely to be central to the pathophysiology.
CDGs are increasingly associated with the presence of a cardiomyopathy (17, 81). The mechanisms linking the variety of glycosylation deficits to cardiac pathology are poorly understood; however, several mechanisms merit future consideration. For example, the lack of sialylation of the sphingolipids on the cardiomyocyte plasma membrane has been shown to increase Ca2+ permeability (82, 83). Higher intracellular Ca2+ concentrations are a known trigger for hypertrophic signaling (84). Altered glycosylation of a variety of ion channel proteins expressed in the heart can change the functional properties of the channels (85–88). Thus, changes in key ionic currents could increase intracellular Ca2+ levels inducing pathological hypertrophy.
In conclusion, the iPSC-CM model of Pompe disease was used to identify a Golgi-based glycosylation deficit potentially central to Pompe cardiac pathophysiology, giving reason to pursue therapeutic avenues aimed at restoring normal glycoprocessing. Future studies will be needed to define how the loss of lysosomal glycogen degradation affects glycosylation and how glycosylation changes are related to the cardiomyopathy. Pompe iPS cell models will provide access to various human cell types relevant for further investigation of the disease and its treatment.
Acknowledgments
Monoclonal antibodies H4A3 and H4B4, developed by J. T. August and J. E. K. Hildreth, and monoclonal antibodies IIH6c4 and VIA4-1, developed by K. P. Campbell, were obtained from the Developmental Studies Hybridoma Bank created by the NICHD, National Institutes of Health, and maintained at the Department of Biology, University of Iowa, Iowa City. We also thank Ben August of the University of Wisconsin Medical School Electron Microscopy Facility for expert advice in processing and imaging tissue samples.
This work was supported, in whole or in part, by National Institutes of Health Grant U01 HL099773 (to T. J. K. and J. A. T.) and by National Institutes of Health-funded Research Resource for Biomedical Glycomics (National Institutes of Health Grant P41GM10349010 to Parastoo Azadi at the Complex Carbohydrate Research Center).

This article contains supplemental Movie 1.
- GAA
- acid α-glucosidase
- iPS
- induced pluripotent stem
- CM
- cardiomyocyte
- iPSC-CM
- induced pluripotent stem cell-derived cardiomyocyte
- LC3
- light chain 3
- ECT
- engineered cardiac tissue
- CQ
- chloroquine
- BFA
- brefeldin A
- LAMP
- lysosome-associated membrane protein
- WGA
- wheat germ agglutinin
- LARGE
- like-acetylglucosaminyltransferase
- αDG
- α-dystroglycan
- αMan
- α-mannosidase
- βDG
- β-dystroglycan
- CDG
- congenital disorder of glycosylation
- 4-MU
- 4-methylumbelliferone
- 4-MUG
- 4-methylumbelliferyl-α-d-glucoside
- cTnT
- cardiac isoform of troponin T
- DSHB
- Developmental Studies Hybridoma Bank
- IEF
- isoelectric focusing
- Endo
- endoglycosidase
- ANOVA
- analysis of variance.
REFERENCES
- 1. van der Ploeg A. T., Reuser A. J. (2008) Pompe's disease. Lancet 372, 1342–1353 [DOI] [PubMed] [Google Scholar]
- 2. Kishnani P. S., Hwu W. L., Mandel H., Nicolino M., Yong F., Corzo D., and Infantile-Onset Pompe Disease Natural History Study Group (2006) A retrospective, multinational, multicenter study on the natural history of infantile-onset Pompe disease. J. Pediatr. 148, 671–676 [DOI] [PubMed] [Google Scholar]
- 3. Kishnani P. S., Goldenberg P. C., DeArmey S. L., Heller J., Benjamin D., Young S., Bali D., Smith S. A., Li J. S., Mandel H., Koeberl D., Rosenberg A., Chen Y. T. (2010) Cross-reactive immunologic material status affects treatment outcomes in Pompe disease infants. Mol. Genet. Metab. 99, 26–33 [DOI] [PMC free article] [PubMed] [Google Scholar]
- 4. Shea L., Raben N. (2009) Autophagy in skeletal muscle: implications for Pompe disease. Int. J. Clin. Pharmacol. Ther. 47, Suppl. 1, S42–S47 [DOI] [PMC free article] [PubMed] [Google Scholar]
- 5. Chen L. R., Chen C. A., Chiu S. N., Chien Y. H., Lee N. C., Lin M. T., Hwu W. L., Wang J. K., Wu M. H. (2009) Reversal of cardiac dysfunction after enzyme replacement in patients with infantile-onset Pompe disease. J. Pediatr. 155, 271–275 [DOI] [PubMed] [Google Scholar]
- 6. McDowell R., Li J. S., Benjamin D. K., Jr., Morgan C., Becker A., Kishnani P. S., Kanter R. J. (2008) Arrhythmias in patients receiving enzyme replacement therapy for infantile Pompe disease. Genet. Med. 10, 758–762 [DOI] [PMC free article] [PubMed] [Google Scholar]
- 7. Thurberg B. L., Lynch Maloney C., Vaccaro C., Afonso K., Tsai A. C., Bossen E., Kishnani P. S., O'Callaghan M. (2006) Characterization of pre- and post-treatment pathology after enzyme replacement therapy for Pompe disease. Lab. Invest. 86, 1208–1220 [DOI] [PubMed] [Google Scholar]
- 8. Xu S., Galperin M., Melvin G., Horowits R., Raben N., Plotz P., Yu L. (2010) Impaired organization and function of myofilaments in single muscle fibers from a mouse model of Pompe disease. J. Appl. Physiol. 108, 1383–1388 [DOI] [PMC free article] [PubMed] [Google Scholar]
- 9. Nascimbeni A. C., Fanin M., Masiero E., Angelini C., Sandri M. (2012) The role of autophagy in the pathogenesis of glycogen storage disease type II (GSDII). Cell Death Differ. 19, 1698–1708 [DOI] [PMC free article] [PubMed] [Google Scholar]
- 10. Raben N., Ralston E., Chien Y. H., Baum R., Schreiner C., Hwu W. L., Zaal K. J., Plotz P. H. (2010) Differences in the predominance of lysosomal and autophagic pathologies between infants and adults with Pompe disease: implications for therapy. Mol. Genet. Metab. 101, 324–331 [DOI] [PMC free article] [PubMed] [Google Scholar]
- 11. Raben N., Hill V., Shea L., Takikita S., Baum R., Mizushima N., Ralston E., Plotz P. (2008) Suppression of autophagy in skeletal muscle uncovers the accumulation of ubiquitinated proteins and their potential role in muscle damage in Pompe disease. Hum. Mol. Genet. 17, 3897–3908 [DOI] [PMC free article] [PubMed] [Google Scholar]
- 12. Takikita S., Myerowitz R., Zaal K., Raben N., Plotz P. H. (2009) Murine muscle cell models for Pompe disease and their use in studying therapeutic approaches. Mol. Genet. Metab. 96, 208–217 [DOI] [PMC free article] [PubMed] [Google Scholar]
- 13. Raben N., Wong A., Ralston E., Myerowitz R. (2012) Autophagy and mitochondria in Pompe disease: nothing is so new as what has long been forgotten. Am. J. Med. Genet. C Semin. Med. Genet. 160, 13–21 [DOI] [PMC free article] [PubMed] [Google Scholar]
- 14. Lieberman A. P., Puertollano R., Raben N., Slaugenhaupt S., Walkley S. U., Ballabio A. (2012) Autophagy in lysosomal storage disorders. Autophagy 8, 719–730 [DOI] [PMC free article] [PubMed] [Google Scholar]
- 15. Moore J. R., Leinwand L., Warshaw D. M. (2012) Understanding cardiomyopathy phenotypes based on the functional impact of mutations in the myosin motor. Circ. Res. 111, 375–385 [DOI] [PMC free article] [PubMed] [Google Scholar]
- 16. De Lange W. J., Grimes A. C., Hegge L. F., Spring A. M., Brost T. M., Ralphe J. C. (2013) E258K HCM-causing mutation in cardiac MyBP-C reduces contractile force and accelerates twitch kinetics by disrupting the cMyBP-C and myosin S2 interaction. J. Gen. Physiol. 142, 241–255 [DOI] [PMC free article] [PubMed] [Google Scholar]
- 17. Footitt E. J., Karimova A., Burch M., Yayeh T., Dupre T., et al. (2009) Cardiomyopathy in the congenital disorders of glycosylation (CDG): a case of late presentation and literature review. J. Inherit. Metab. Dis. 32, Suppl. 1, S313–S319 [DOI] [PubMed] [Google Scholar]
- 18. Maron B. J., Roberts W. C., Arad M., Haas T. S., Spirito P., Wright G. B., Almquist A. K., Baffa J. M., Saul J. P., Ho C. Y., Seidman J., Seidman C. E. (2009) Clinical outcome and phenotypic expression in LAMP2 cardiomyopathy. JAMA 301, 1253–1259 [DOI] [PMC free article] [PubMed] [Google Scholar]
- 19. Yu J., Hu K., Smuga-Otto K., Tian S., Stewart R., Slukvin I. I., Thomson J. A. (2009) Human induced pluripotent stem cells free of vector and transgene sequences. Science 324, 797–801 [DOI] [PMC free article] [PubMed] [Google Scholar]
- 20. Ludwig T. E., Levenstein M. E., Jones J. M., Berggren W. T., Mitchen E. R., Frane J.L., Crandall L. J., Daigh C. A., Conard K. R., Piekarczyk M. S., Llanas R. A., Thomson J. A. (2006) Derivation of human embryonic stem cells in defined conditions. Nat. Biotechnol. 24, 185–187 [DOI] [PubMed] [Google Scholar]
- 21. Reuser A. J., Koster J. F., Hoogeveen A., Galjaard H. (1978) Biochemical, immunological, and cell genetic studies in glycogenosis type II. Am. J. Hum. Genet. 30, 132–143 [PMC free article] [PubMed] [Google Scholar]
- 22. Lian X., Hsiao C., Wilson G., Zhu K., Hazeltine L. B., Azarin S. M., Raval K. K., Zhang J., Kamp T. J., Palecek S. P. (2012) Robust cardiomyocyte differentiation from human pluripotent stem cells via temporal modulation of canonical Wnt signaling. Proc. Natl. Acad. Sci. U.S.A. 109, E1848–E1857 [DOI] [PMC free article] [PubMed] [Google Scholar]
- 23. Schaaf S., Shibamiya A., Mewe M., Eder A., Stöhr A., Hirt M. N., Rau T., Zimmermann W. H., Conradi L., Eschenhagen T., Hansen A. (2011) Human engineered heart tissue as a versatile tool in basic research and preclinical toxicology. PLoS One 6, e26397. [DOI] [PMC free article] [PubMed] [Google Scholar]
- 24. Hansen A., Eder A., Bönstrup M., Flato M., Mewe M., Schaaf S., Aksehirlioglu B., Schwoerer A. P., Schwörer A., Uebeler J., Eschenhagen T. (2010) Development of a drug screening platform based on engineered heart tissue. Circ. Res. 107, 35–44 [DOI] [PubMed] [Google Scholar]
- 25. de Lange W. J., Hegge L. F., Grimes A. C., Tong C. W., Brost T. M., Moss R. L., Ralphe J. C. (2011) Neonatal mouse-derived engineered cardiac tissue: a novel model system for studying genetic heart disease. Circ. Res. 109, 8–19 [DOI] [PMC free article] [PubMed] [Google Scholar]
- 26. Wessel D., Flügge U. I. (1984) A method for the quantitative recovery of protein in dilute solution in the presence of detergents and lipids. Anal. Biochem. 138, 141–143 [DOI] [PubMed] [Google Scholar]
- 27. Michele D. E., Barresi R., Kanagawa M., Saito F., Cohn R. D., Satz J. S., Dollar J., Nishino I., Kelley R. I., Somer H., Straub V., Mathews K. D., Moore S. A., Campbell K. P. (2002) Post-translational disruption of dystroglycan-ligand interactions in congenital muscular dystrophies. Nature 418, 417–422 [DOI] [PubMed] [Google Scholar]
- 28. O'Farrell P. H. (1975) High resolution two-dimensional electrophoresis of proteins. J. Biol. Chem. 250, 4007–4021 [PMC free article] [PubMed] [Google Scholar]
- 29. Burgess-Cassler A., Johansen J. J., Santek D. A., Ide J. R., Kendrick N. C. (1989) Computerized quantitative analysis of Coomassie-blue-stained serum proteins separated by two-dimensional electrophoresis. Clin. Chem. 35, 2297–2304 [PubMed] [Google Scholar]
- 30. Anumula K. R., Taylor P. B. (1992) A comprehensive procedure for preparation of partially methylated alditol acetates from glycoprotein carbohydrates. Anal. Biochem. 203, 101–108 [DOI] [PubMed] [Google Scholar]
- 31. Yu J., Vodyanik M. A., Smuga-Otto K., Antosiewicz-Bourget J., Frane J. L., Tian S., Nie J., Jonsdottir G. A., Ruotti V., Stewart R., Slukvin I. I., Thomson J. A. (2007) Induced pluripotent stem cell lines derived from human somatic cells. Science 318, 1917–1920 [DOI] [PubMed] [Google Scholar]
- 32. Moreland R. J., Jin X., Zhang X. K., Decker R. W., Albee K. L., Lee K. L., Cauthron R. D., Brewer K., Edmunds T., Canfield W.M. (2005) Lysosomal acid α-glucosidase consists of four different peptides processed from a single chain precursor. J. Biol. Chem. 280, 6780–6791 [DOI] [PubMed] [Google Scholar]
- 33. Ausems M. G., Kroos M. A., Van der Kraan M., Smeitink J. A., Kleijer W. J., Ploos van Amstel H. K., Reuser A. J. (1996) Homozygous deletion of exon 18 leads to degradation of the lysosomal α-glucosidase precursor and to the infantile form of glycogen storage disease type II. Clin. Genet. 49, 325–328 [DOI] [PubMed] [Google Scholar]
- 34. Lynch C. M., Johnson J., Vaccaro C., Thurberg B. L. (2005) High-resolution light microscopy (HRLM) and digital analysis of Pompe disease pathology. J. Histochem. Cytochem. 53, 63–73 [DOI] [PubMed] [Google Scholar]
- 35. Knaapen M. W., Vrolijk B. C., Wenink A. C. (1997) Ultrastructural changes of the myocardium in the embryonic rat heart. Anat. Rec. 248, 233–241 [DOI] [PubMed] [Google Scholar]
- 36. Klionsky D. J., Abdalla F. C., Abeliovich H., Abraham R. T., Acevedo-Arozena A., Adeli K., Agholme L., Agnello M., Agostinis P., Aguirre-Ghiso J. A., Ahn H. J., Ait-Mohamed O., Ait-Si-Ali S., Akematsu T., Akira S., et al. (2012) Guidelines for the use and interpretation of assays for monitoring autophagy. Autophagy 8, 445–544 [DOI] [PMC free article] [PubMed] [Google Scholar]
- 37. Meikle P. J., Brooks D. A., Ravenscroft E. M., Yan M., Williams R. E., Jaunzems A. E., Chataway T. K., Karageorgos L. E., Davey R. C., Boulter C. D., Carlsson S. R., Hopwood J. J. (1997) Diagnosis of lysosomal storage disorders: evaluation of lysosome-associated membrane protein LAMP-1 as a diagnostic marker. Clin. Chem. 43, 1325–1335 [PubMed] [Google Scholar]
- 38. Carlsson S. R., Roth J., Piller F., Fukuda M. (1988) Isolation and characterization of human lysosomal membrane glycoproteins, h-lamp-1 and h-lamp-2: major sialoglycoproteins carrying polylactosaminoglycan. J. Biol. Chem. 263, 18911–18919 [PubMed] [Google Scholar]
- 39. Carlsson S. R., Lycksell P. O., Fukuda M. (1993) Assignment of O-glycan attachment sites to the hinge-like regions of human lysosomal membrane glycoproteins lamp-1 and lamp-2. Arch. Biochem. Biophys. 304, 65–73 [DOI] [PubMed] [Google Scholar]
- 40. Nabi I. R., Dennis J. W. (1998) The extent of polylactosamine glycosylation of MDCK LAMP-2 is determined by its Golgi residence time. Glycobiology 8, 947–953 [DOI] [PubMed] [Google Scholar]
- 41. Carlsson S. R., Fukuda M. (1990) The polylactosaminoglycans of human lysosomal membrane glycoproteins lamp-1 and lamp-2: localization on the peptide backbones. J. Biol. Chem. 265, 20488–20495 [PubMed] [Google Scholar]
- 42. Fujiwara T., Oda K., Yokota S., Takatsuki A., Ikehara Y. (1988) Brefeldin A causes disassembly of the Golgi complex and accumulation of secretory proteins in the endoplasmic reticulum. J. Biol. Chem. 263, 18545–18552 [PubMed] [Google Scholar]
- 43. Isaac E. L., Karageorgos L. E., Brooks D. A., Hopwood J. J., Meikle P. J. (2000) Regulation of the lysosome-associated membrane protein in a sucrose model of lysosomal storage. Exp. Cell Res. 254, 204–209 [DOI] [PubMed] [Google Scholar]
- 44. Alberts B., Johnson A., Lewis J., Raff M., Roberts K., Walker P. (2002) Transport from the ER through the Golgi apparatus. in Molecular Biology of the Cell, 4th Ed., Garland Science, New York, http://www.ncbi.nlm.nih.gov/books/NBK26941/ [Google Scholar]
- 45. Chen J. W., Pan W., D'Souza M. P., August J. T. (1985) Lysosome-associated membrane proteins: characterization of LAMP-1 of macrophage P388 and mouse embryo 3T3 cultured cells. Arch. Biochem. Biophys. 239, 574–586 [DOI] [PubMed] [Google Scholar]
- 46. Chui D., Oh-Eda M., Liao Y. F., Panneerselvam K., Lal A., Marek K. W., Freeze H. H., Moremen K. W., Fukuda M. N., Marth J. D. (1997) α-Mannosidase-II deficiency results in dyserythropoiesis and unveils an alternate pathway in oligosaccharide biosynthesis. Cell 90, 157–167 [DOI] [PubMed] [Google Scholar]
- 47. Brockington M., Torelli S., Prandini P., Boito C., Dolatshad N. F., Longman C., Brown S. C., Muntoni F. (2005) Localization and functional analysis of the LARGE family of glycosyltransferases: significance for muscular dystrophy. Hum. Mol. Genet. 14, 657–665 [DOI] [PubMed] [Google Scholar]
- 48. Inamori K., Yoshida-Moriguchi T., Hara Y., Anderson M. E., Yu L., Campbell K. P. (2012) Dystroglycan function requires xylosyl- and glucuronyltransferase activities of LARGE. Science 335, 93–96 [DOI] [PMC free article] [PubMed] [Google Scholar]
- 49. Kanagawa M., Saito F., Kunz S., Yoshida-Moriguchi T., Barresi R., Kobayashi Y. M., Muschler J., Dumanski J. P., Michele D. E., Oldstone M. B., Campbell K. P. (2004) Molecular recognition by LARGE is essential for expression of functional dystroglycan. Cell 117, 953–964 [DOI] [PubMed] [Google Scholar]
- 50. Sparks S., Quijano-Roy S., Harper A., Rutkowski A., Gordon E., Hoffman E. P., Pegoraro E. (1993) in GeneReviews® [Internet] (Pagon R. A., Adam M. P., Ardinger H. H., et al., eds) Congenital Muscular Dystrophy Overview, University of Washington, Seattle: http://www.ncbi.nlm.nih.gov/books/NBK1291 [PubMed] [Google Scholar]
- 51. Ervasti J. M., Campbell K. P. (1993) A role for the dystrophin-glycoprotein complex as a transmembrane linker between laminin and actin. J. Cell Biol. 122, 809–823 [DOI] [PMC free article] [PubMed] [Google Scholar]
- 52. Michele D. E., Campbell K. P. (2003) Dystrophin-glycoprotein complex: post-translational processing and dystroglycan function. J. Biol. Chem. 278, 15457–15460 [DOI] [PubMed] [Google Scholar]
- 53. Cohen M. W., Jacobson C., Yurchenco P. D., Morris G. E., Carbonetto S. (1997) Laminin-induced clustering of dystroglycan on embryonic muscle cells: comparison with agrin-induced clustering. J. Cell Biol. 136, 1047–1058 [DOI] [PMC free article] [PubMed] [Google Scholar]
- 54. Montanaro F., Lindenbaum M., Carbonetto S. (1999) alpha-Dystroglycan is a laminin receptor involved in extracellular matrix assembly on myotubes and muscle cell viability. J. Cell Biol. 145, 1325–1340 [DOI] [PMC free article] [PubMed] [Google Scholar]
- 55. Gehrmann J., Sohlbach K., Linnebank M., Böhles H. J., Buderus S., Kehl H. G., Vogt J., Harms E., Marquardt T. (2003) Cardiomyopathy in congenital disorders of glycosylation. Cardiol. Young 13, 345–351 [PubMed] [Google Scholar]
- 56. Kranz C., Basinger A. A., Gucsavas-Calikoglu M., Sun L., Powell C. M., Henderson F. W., Aylsworth A. S., Freeze H. H. (2007) Expanding spectrum of congenital disorder of glycosylation Ig (CDG-Ig): sibs with a unique skeletal dysplasia, hypogammaglobulinemia, cardiomyopathy, genital malformations, and early lethality. Am. J. Med. Genet. A 143A, 1371–1378 [DOI] [PubMed] [Google Scholar]
- 57. Kapusta L., Zucker N., Frenckel G., Medalion B., Ben Gal T., Birk E., Mandel H., Nasser N., Morgenstern S., Zuckermann A., Lefeber D. J., de Brouwer A., Wevers R. A., Lorber A., Morava E. (2013) From discrete dilated cardiomyopathy to successful cardiac transplantation in congenital disorders of glycosylation due to dolichol kinase deficiency (DK1-CDG). Heart Fail. Rev. 18, 187–196 [DOI] [PMC free article] [PubMed] [Google Scholar]
- 58. Chen C. A., Chien Y. H., Hwu W. L., Lee N. C., Wang J. K., Chen L. R., Lu C. W., Lin M. T., Chiu S. N., Chiu H. H., Wu M. H. (2011) Left ventricular geometry, global function, and dyssynchrony in infants and children with Pompe cardiomyopathy undergoing enzyme replacement therapy. J. Card. Fail. 17, 930–936 [DOI] [PubMed] [Google Scholar]
- 59. Raben N., Danon M., Gilbert A. L., Dwivedi S., Collins B., Thurberg B. L., Mattaliano R. J., Nagaraju K., Plotz P. H. (2003) Enzyme replacement therapy in the mouse model of Pompe disease. Mol. Genet. Metab. 80, 159–169 [DOI] [PubMed] [Google Scholar]
- 60. Raben N., Fukuda T., Gilbert A. L., de Jong D., Thurberg B. L., Mattaliano R. J., Meikle P., Hopwood J. J., Nagashima K., Nagaraju K., Plotz P. H. (2005) Replacing acid α-glucosidase in Pompe disease: recombinant and transgenic enzymes are equipotent, but neither completely clears glycogen from type II muscle fibers. Mol. Ther. 11, 48–56 [DOI] [PubMed] [Google Scholar]
- 61. Duplomb L., Duvet S., Picot D., Jego G., El Chehadeh-Djebbar S., Marlem N., Gigot N., Aral B., Carmignac V., Thevenon J., Lopez E., Rivière J. B., Klein A., Philippe C., Droin N., Blair E., Girodon F., Donadieu J., Bellanné-Chantelot C., Delva L., Michalski J. C., Solary E., Faivre L., Foulquier F., Thauvin-Robinet C. (2014) Cohen syndrome is associated with major glycosylation defects. Hum. Mol. Genet. 23, 2391–2399 [DOI] [PubMed] [Google Scholar]
- 62. Shestakova A., Zolov S., Lupashin V. (2006) COG complex-mediated recycling of Golgi glycosyltransferases is essential for normal protein glycosylation. Traffic 7, 191–204 [DOI] [PubMed] [Google Scholar]
- 63. Foulquier F., Amyere M., Jaeken J., Zeevaert R., Schollen E., Race V., Bammens R., Morelle W., Rosnoblet C., Legrand D., Demaegd D., Buist N., Cheillan D., Guffon N., Morsomme P., Annaert W., Freeze H. H., Van Schaftingen E., Vikkula M., Matthijs G. (2012) TMEM165 deficiency causes a congenital disorder of glycosylation. Am. J. Hum. Genet. 91, 15–26 [DOI] [PMC free article] [PubMed] [Google Scholar]
- 64. Sparks S. E., Krasnewich D. M. (2005) in GeneReviews® [Internet] (Pagon R. A., Adam M. P., Ardinger H. H., et al., eds) Congenital Disorders of N-linked Glycosylation Pathway Overview, University of Washington, Seattle, http://www.ncbi.nlm.nih.gov/books/NBK1332 [PubMed] [Google Scholar]
- 65. Wopereis S., Grünewald S., Morava E., Penzien J. M., Briones P., García-Silva M. T., Demacker P. N., Huijben K. M., Wevers R. A. (2003) Apolipoprotein C-III isofocusing in the diagnosis of genetic defects in O-glycan biosynthesis. Clin. Chem. 49, 1839–1845 [DOI] [PubMed] [Google Scholar]
- 66. Carchon H. A., Chevigné R., Falmagne J. B., Jaeken J. (2004) Diagnosis of congenital disorders of glycosylation by capillary zone electrophoresis of serum transferrin. Clin. Chem. 50, 101–111 [DOI] [PubMed] [Google Scholar]
- 67. Freeze H. H., Schachter H. (2009) Genetic disorders of glycosylation, in Essentials of Glycobiology (Varki A., Cummings R. D., Esko J. D., Freeze H. H., Stanley P., Bertozzi C. R., Hart G. W., Etzler M. E., eds) 2nd Ed., Cold Spring Harbor Laboratory, Cold Spring Harbor, NY, http://www.ncbi.nlm.nih.gov/books/NBK1939 [PubMed] [Google Scholar]
- 68. Freeze H. H., Aebi M. (2005) Altered glycan structures: the molecular basis of congenital disorders of glycosylation. Curr. Opin. Struct. Biol. 15, 490–498 [DOI] [PubMed] [Google Scholar]
- 69. Taylor K. M., Meyers E., Phipps M., Kishnani P. S., Cheng S. H., Scheule R. K., Moreland R. J. (2013) Dysregulation of multiple facets of glycogen metabolism in a murine model of Pompe disease. PLoS One 8, e56181. [DOI] [PMC free article] [PubMed] [Google Scholar]
- 70. Poüs C., Guibourdenche J., Drechou A., Durand G. (1994) Differential secretion of α1-acid glycoprotein occurs in the Golgi complex of isolated rat hepatocytes: evidence of partial retention in the Golgi. Eur. J. Biochem. 219, 1073–1079 [DOI] [PubMed] [Google Scholar]
- 71. Hayee B., Antonopoulos A., Murphy E. J., Rahman F. Z., Sewell G., Smith B. N., McCartney S., Furman M., Hall G., Bloom S. L., Haslam S. M., Morris H. R., Boztug K., Klein C., Winchester B., Pick E., Linch D. C., Gale R. E., Smith A. M., Dell A., Segal A. W. (2011) G6PC3 mutations are associated with a major defect of glycosylation: a novel mechanism for neutrophil dysfunction. Glycobiology 21, 914–924 [DOI] [PMC free article] [PubMed] [Google Scholar]
- 72. Freeze H. H., Chong J. X., Bamshad M. J., Ng B. G. (2014) Solving glycosylation disorders: fundamental approaches reveal complicated pathways. Am. J. Hum. Genet. 94, 161–175 [DOI] [PMC free article] [PubMed] [Google Scholar]
- 73. Szumilo T., Kaushal G. P., Elbein A. D. (1987) Purification and properties of the glycoprotein processing N-acetylglucosaminyltransferase II from plants. Biochemistry 26, 5498–5505 [DOI] [PubMed] [Google Scholar]
- 74. Ikeda Y., Koyota S., Ihara H., Yamaguchi Y., Korekane H., Tsuda T., Sasai K., Taniguchi N. (2000) Kinetic basis for the donor nucleotide-sugar specificity of β1,4-N-acetylglucosaminyltransferase III. J. Biochem. 128, 609–619 [DOI] [PubMed] [Google Scholar]
- 75. Sasai K., Ikeda Y., Fujii T., Tsuda T., Taniguchi N. (2002) UDP-GlcNAc concentration is an important factor in the biosynthesis of β1,6-branched oligosaccharides: regulation based on the kinetic properties of N-acetylglucosaminyltransferase V. Glycobiology 12, 119–127 [DOI] [PubMed] [Google Scholar]
- 76. Elices M. J., Goldstein I. J. (1990) Initiation of poly-N-acetyllactosamine chain biosynthesis occurs preferentially on complex multiantennary asparagine-linked oligosaccharides. Carbohydr. Res. 203, 109–118 [DOI] [PubMed] [Google Scholar]
- 77. Akama T. O., Nakagawa H., Wong N. K., Sutton-Smith M., Dell A., Morris H. R., Nakayama J., Nishimura S., Pai A., Moremen K. W., Marth J. D., Fukuda M. N. (2006) Essential and mutually compensatory roles of α-mannosidase II and α-mannosidase IIx in N-glycan processing in vivo in mice. Proc. Natl. Acad. Sci. U.S.A. 103, 8983–8988 [DOI] [PMC free article] [PubMed] [Google Scholar]
- 78. Abdul Rahman S., Bergström E., Watson C. J., Wilson K. M., Ashford D. A., Thomas J. R., Ungar D., Thomas-Oates J. E. (2014) Filter-aided N-glycan separation (FANGS): a convenient sample preparation method for mass spectrometric N-glycan profiling. J. Proteome Res. 13, 1167–1176 [DOI] [PMC free article] [PubMed] [Google Scholar]
- 79. Wells L. (2013) The O-mannosylation pathway: glycosyltransferases and proteins implicated in congenital muscular dystrophy. J. Biol. Chem. 288, 6930–6935 [DOI] [PMC free article] [PubMed] [Google Scholar]
- 80. Kabaeva Z., Meekhof K. E., Michele D. E. (2011) Sarcolemma instability during mechanical activity in Largemyd cardiac myocytes with loss of dystroglycan extracellular matrix receptor function. Hum. Mol. Genet. 20, 3346–3355 [DOI] [PMC free article] [PubMed] [Google Scholar]
- 81. Marquardt T., Denecke J. (2003) Congenital disorders of glycosylation: review of their molecular bases, clinical presentations and specific therapies. Eur. J. Pediatr. 162, 359–379 [DOI] [PubMed] [Google Scholar]
- 82. Marengo F. D., Wang S. Y., Wang B., Langer G. A. (1998) Dependence of cardiac cell Ca2+ permeability on sialic acid-containing sarcolemmal gangliosides. J. Mol. Cell. Cardiol. 30, 127–137 [DOI] [PubMed] [Google Scholar]
- 83. Post J. A. (1992) Removal of sarcolemmal sialic acid residues results in a loss of sarcolemmal functioning and integrity. Am. J. Physiol. 263, H147–H152 [DOI] [PubMed] [Google Scholar]
- 84. Wilkins B. J., Molkentin J. D. (2004) Calcium-calcineurin signaling in the regulation of cardiac hypertrophy. Biochem. Biophys. Res. Commun. 322, 1178–1191 [DOI] [PubMed] [Google Scholar]
- 85. Montpetit M. L., Stocker P. J., Schwetz T. A., Harper J. M., Norring S. A., Schaffer L., North S. J., Jang-Lee J., Gilmartin T., Head S. R., Haslam S. M., Dell A., Marth J. D., Bennett E. S. (2009) Regulated and aberrant glycosylation modulate cardiac electrical signaling. Proc. Natl. Acad. Sci. U.S.A. 106, 16517–16522 [DOI] [PMC free article] [PubMed] [Google Scholar]
- 86. Fermini B., Nathan R. D. (1991) Removal of sialic acid alters both T- and L-type calcium currents in cardiac myocytes. Am. J. Physiol. 260, H735–H743 [DOI] [PubMed] [Google Scholar]
- 87. Norring S. A., Ednie A. R., Schwetz T. A., Du D., Yang H., Bennett E. S. (2013) Channel sialic acids limit hERG channel activity during the ventricular action potential. FASEB J. 27, 622–631 [DOI] [PubMed] [Google Scholar]
- 88. Ednie A. R., Horton K. K., Wu J., Bennett E. S. (2013) Expression of the sialyltransferase, ST3Gal4, impacts cardiac voltage-gated sodium channel activity, refractory period, and ventricular conduction. J. Mol. Cell Cardiol. 59, 117–127 [DOI] [PubMed] [Google Scholar]