
Figure 4.
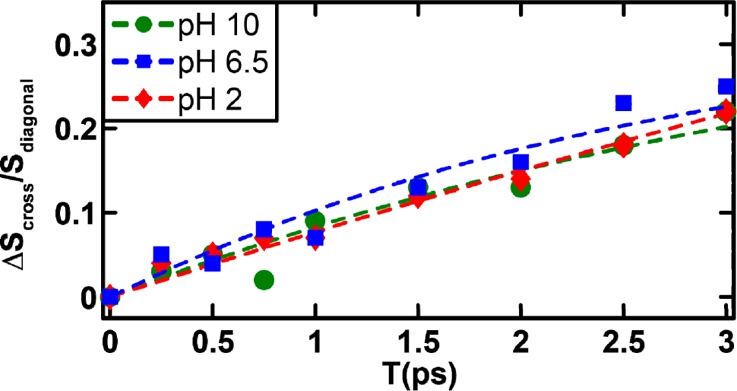
Evolution of the cross-peak to diagonal-peak ratio as a function of the waiting time for different pH values, as indicated. The dashed lines represent fits to a two-state kinetic model, as discussed in the text, and the resultant fitting parameters are listed in Table 1