
Figure 2.
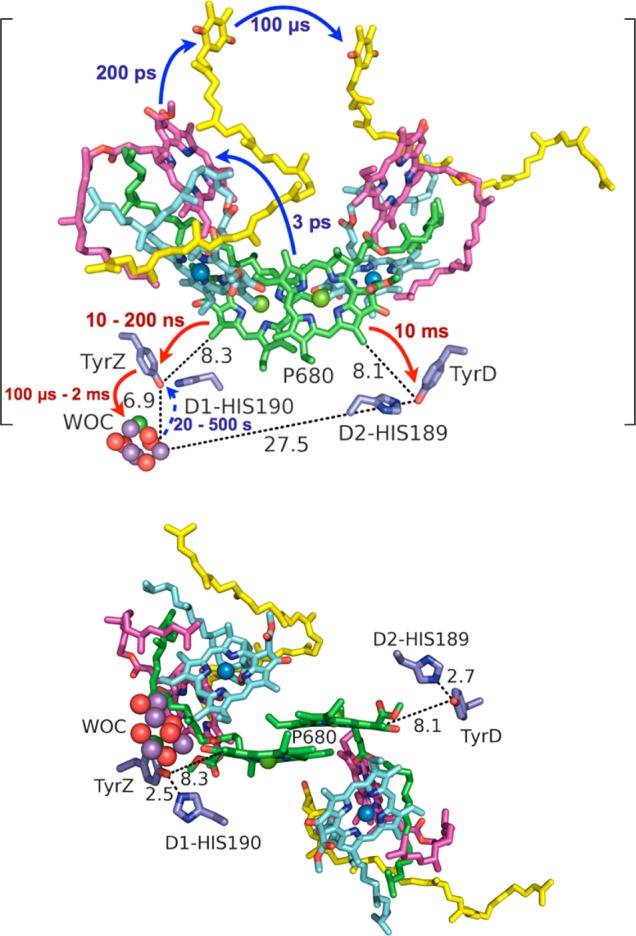
Top: Time scales of electron transfer (blue arrows) and hole transfer (red arrows) of the initial photosynthetic charge transfer events in PSII, including water oxidation.51−53 The time scale of unproductive back electron transfer from the WOC to TyrZ is shown with a dashed arrow. Auxiliary chlorophylls are shown in light blue, pheophytins in magenta, and quinones A (QA) and B (QB) in yellow. WOC = water-oxidizing complex. Distances shown (dotted lines) are in angstroms. The brackets emphasize that the protein complex is housed within a bilayer membrane. Bottom: Alternative view of the PSII reaction center displaying the locations of TyrZ and TyrD in relation to P680, with H-bond distances to histidine (His) shown in angstroms. The figure was rendered using PyMol.54