
Figure 32.
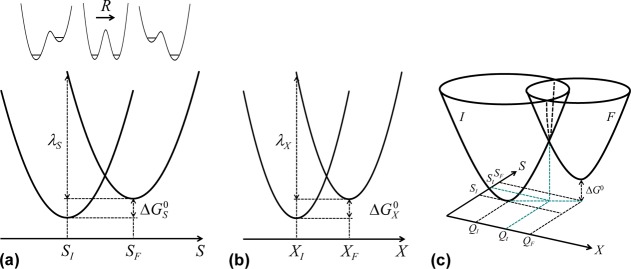
Free energy landscapes for the Borgis–Hynes theory of PT and HAT. (a) Free energy profile for the transferring H species along the solvent coordinate S. The pertinent free energy of reaction or asymmetry ΔGS° and reorganization energy λS are shown. The H double wells at different S values are also depicted. In the model, the activation barrier along the H coordinate (R) is significantly higher than the S-dependent reaction free energy (the asymmetry is magnified in the PESs for the R coordinate of panel a). (b) Free energy profile along the intramolecular coordinate X defining the H donor–acceptor distance. The X dependence of the potential double wells for the H dynamics may be represented as the S dependence in panel a. (c) Full free energy landscape as a function of S and X (cf. Figure 1 in ref (192)).