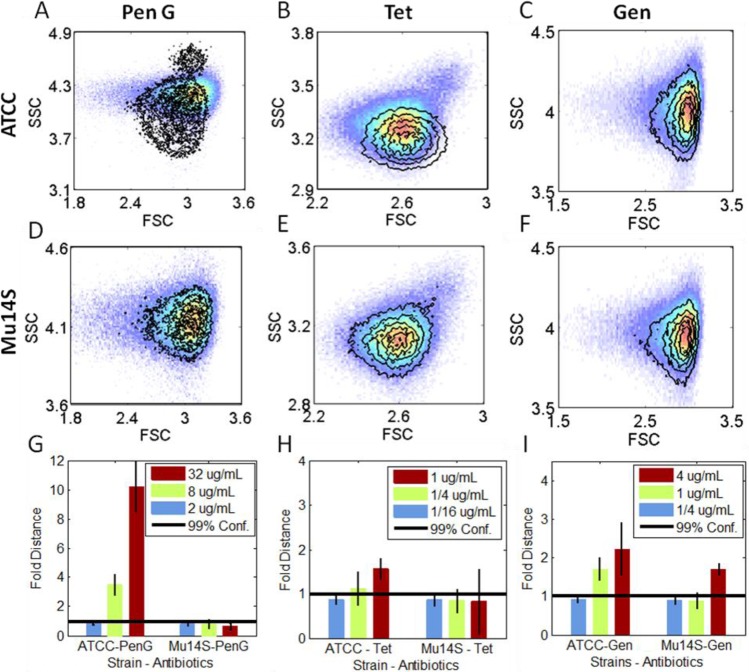
Figure 2.
Signal changes induced by antibiotic treatments in E. coli with different susceptibilities. All data were collected in the presence of MH-IR786. (A to F) Scatter signal changes. The pseudocolor plots are the no antibiotic paired control, for each strain. The overlaid contour plots are the 1x MIC antibiotic concentration scatter data. (A to C) The lab strain E. coli (ATCC 33456). (D to F) The multidrug clinical strain E. coli (Mu14S). (G to I) PB-sQF 3D test results. First column (A, D, and G) penicillin G; second column (B, E, and H) tetracycline; third column (C, F, and I) gentamicin. Penicillin G and tetracycline were examined at the 1x, 1/4x, and 1/16x of MIC of ATCC (32 and 1 μg/mL, respectively). Gentamicin was applied at the MIC of Mu14S (4 μg/mL). FSC: forward scatter. SSC: side scatter. (Corresponding fluorescence data can be found in the Supporting Information).

