
Figure 3.
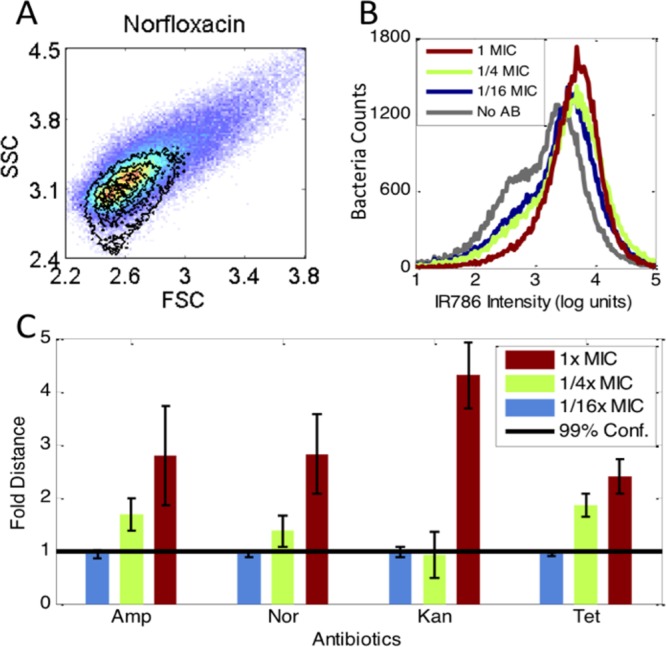
PB-sQF registered antibiotic-induced signal changes in P. aeruginosa. (A) Scatter signal changes by norfloxacin. The pseudocolor plots are the no antibiotic control. The contour plots lay above were the 1x MIC scatter data. (B) Norfloxacin-induced MH-IR786 fluorescence signal changes. (C) The 3D PB-sQF test results for norfloxacin and other antibiotics-induced signal changes.