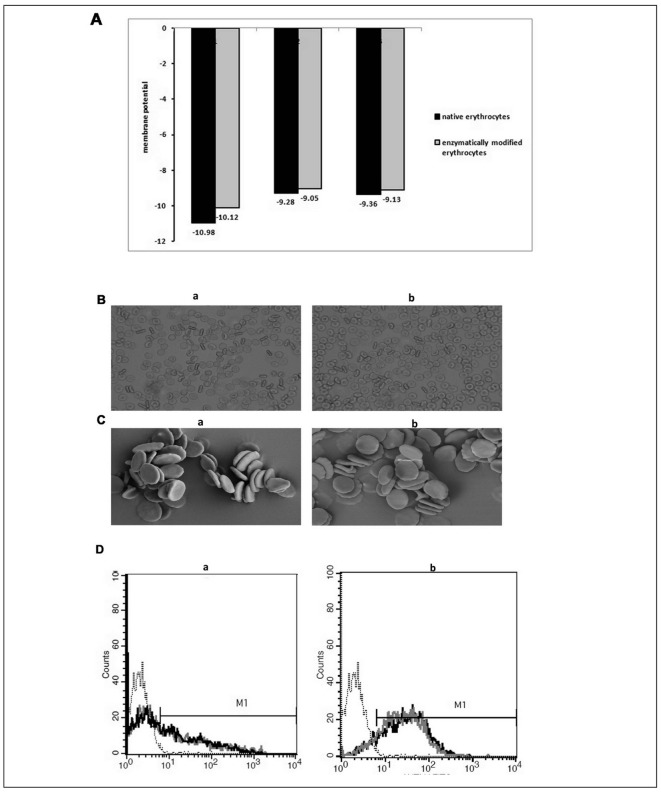
Figure 3.
The detection of absolute membrane potential (A), shape of erythrocytes (B and C) and type 3 chain H structure (D).
A, the three values of absolute membrane potential of erythrocytes. B, the shape of erythrocytes captured by optical microscope (100×). Native erythrocytes (a) and FM-erythrocytes (b). C, erythrocyte images from scanning electron microscopy (SEM). Native erythrocytes (a) and FM-erythrocytes (b). D, the number of type 3 chain H structure on A1 (a) and A2 (b) erythrocytes. The type 3 chain H structure site density on negative O (⋯⋯, black dotted thread), native A1 (–, black solid thread) and A2 (–, black solid thread), TM-A1 (–, grey solid thread) and TM-A2 erythrocytes (–, grey solid thread).

