
Fig. 5.
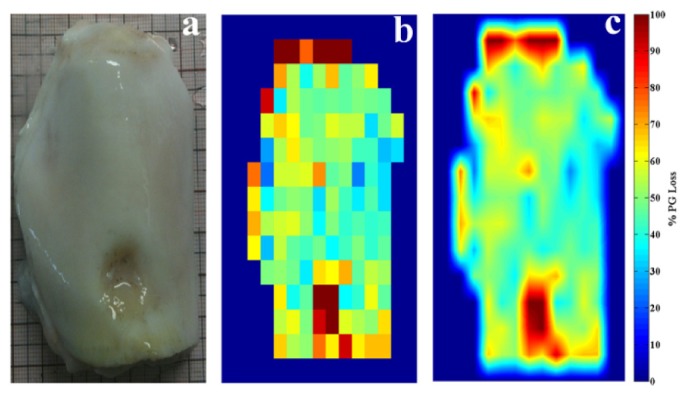
(a) Image of bovine patella with focal defect. (b) Raw (low-resolution) image of PG distribution across sample. (c) Smoothed (bilinear interpolated) image showing distribution of percentage PG loss across sample.
Official websites use .gov
A
.gov website belongs to an official
government organization in the United States.
Secure .gov websites use HTTPS
A lock (
) or https:// means you've safely
connected to the .gov website. Share sensitive
information only on official, secure websites.
(a) Image of bovine patella with focal defect. (b) Raw (low-resolution) image of PG distribution across sample. (c) Smoothed (bilinear interpolated) image showing distribution of percentage PG loss across sample.