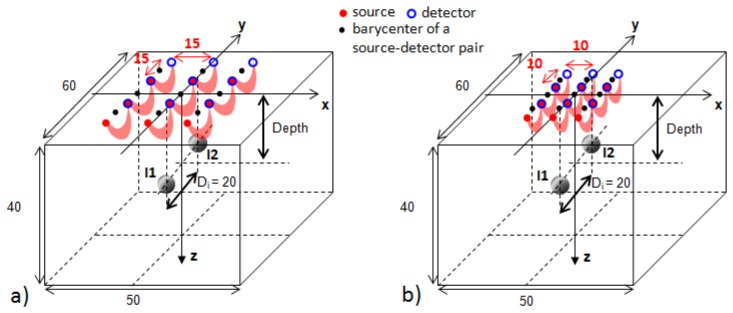
Fig. 1.

Acquisition geometries: a) probe with SD = 15 mm, b) probe with SD = 10 mm. Red areas schematically depict the “banana shapes” or sensitivity matrices of the measurements between pairs used for DOT reconstructions (9 in total for each probe). For both probes, the barycenter of the central source-detector pair is aligned with the barycenter of the two inclusions along the y axis. The parallelepiped of 50 x 60 x 40 mm depicts the volume employed in the DOT reconstructions. All dimensions are in mm.
