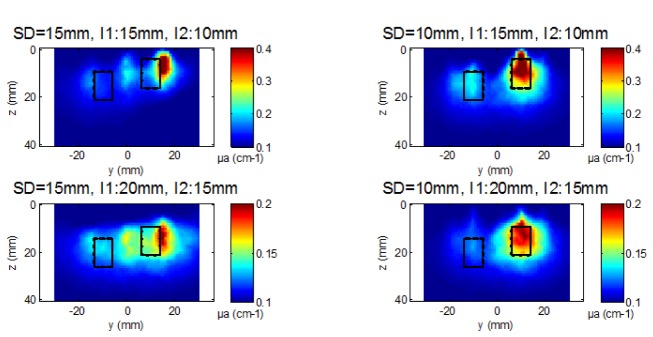
Fig. 6.

Reconstructed µa maps with experimental data (cut views along plane (y,z) at x = 0) for both probes for the depth of 15 mm for I1 (left inclusion) and 10 mm for I2 (right inclusion) on the top row and the depth of 20 mm for I1 and 15 mm for I2 on the bottom row. Black rectangles indicate the real position and size of the two inclusions.
