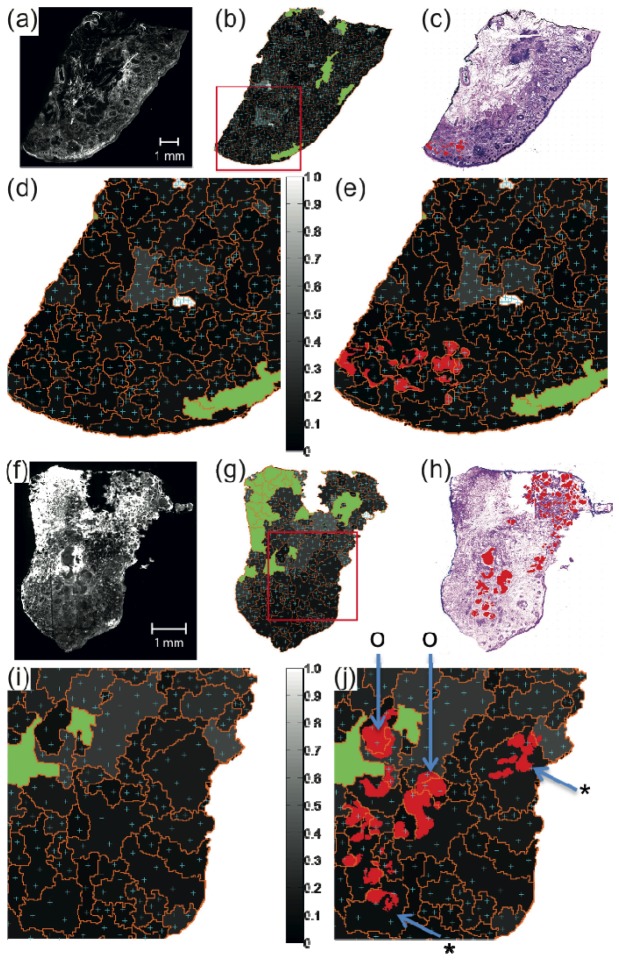
Fig. 5.
Generation of sampling points for Raman spectropscopy based on AF intensity images for two tissue samples. (a), (f) AF images, (b), (g) the intensity variance maps for the segmented AF images (gray scale) with estimated sampling points (cyan), segment-boundary (orange) and segments AF intensity above threshold (green). (c), (h): H&E-stained skin tissue image with BCC highlights in red. (d), (e) and (i), (j): zoom-in images of the red square region in (b) and (g). In (e) and (j), BCCs are additionally highlighted in red. For both skin tissue samples, the segmentation function optimized for large BCC was applied with Nmin = 2 and σsampling = 2,000 spectra cm−2.

