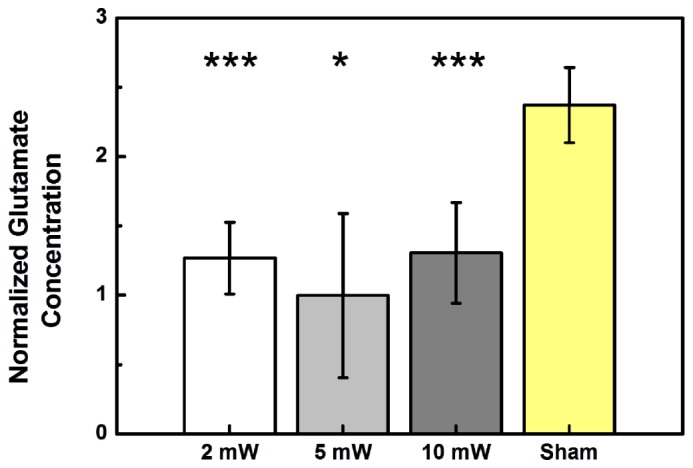
Fig. 5.

Effects of light stimulation on glutamate in the striatum at three different optical power levels (2 mW, 5 mW, and 10 mW). The normalized glutamate concentration varies with the stimulating optical power. Sham animals were not optically stimulated. (N = 5 in each column.)
