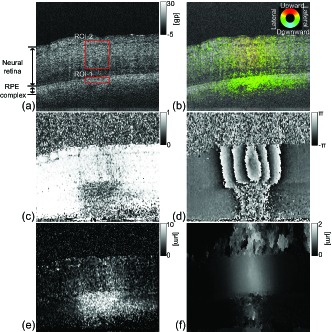
Fig. 7.

(a) OCT B-scan intensity image at t = 24 ms. Red boxes indicate the regions of interest. Each sub-figure shows (b) a 2D displacement map where the color hue represents the directions of the displacement as represented in a color wheel, (c) a noise-free sample correlation coefficient map, (d) the Doppler phase shift prior to phase unwrapping, (e) the measured lateral displacement, and (f) the measured axial displacement.
