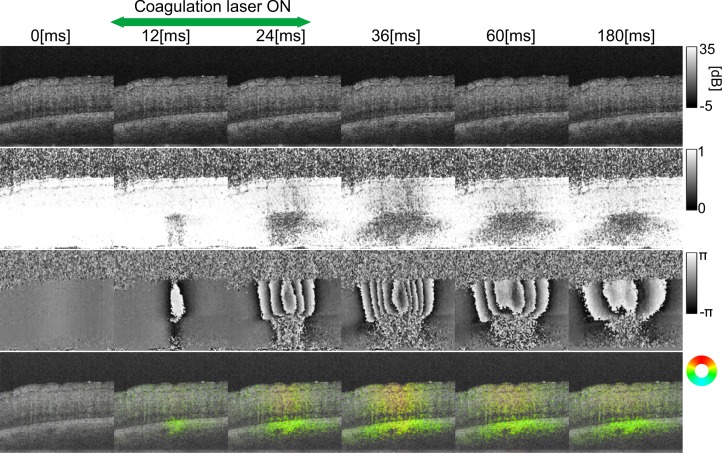
Fig. 8.
The OCT intensity (first row), the noise-free sample correlation coefficients (second row), the Doppler phase shifts (third row) and the displacement map (fourth row) are shown at different time points. The full sequence of images is shown in Media 1 (572.7KB, MOV) , in which the duration of the laser irradiation is indicated by the green frame.

