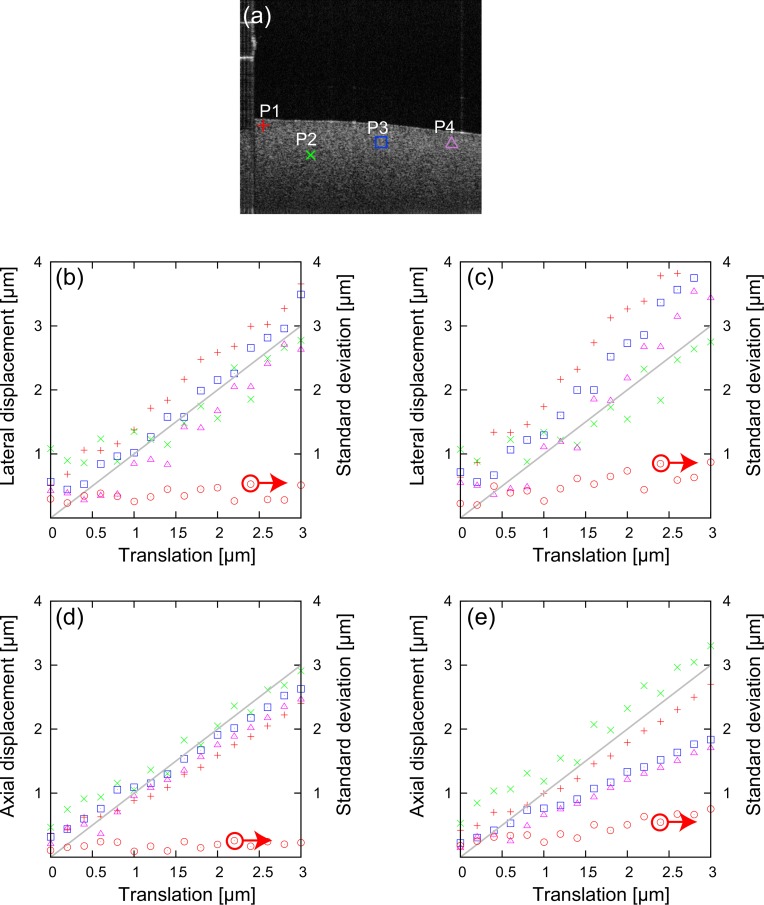
Fig. 9.
(a) Representative OCT B-scan image of the tissue phantom. The red cross (+), green cross (×), blue box, and purple triangle indicate the randomly-selected positions (P1–P4). The lateral displacements using (b) method-1 and (c) method-2. The axial displacements using (d) method-1 and (e) method-2. The red crosses (+), green crosses (×), blue boxes, and purple triangles represent the average displacement at P1–P4, respectively. The red circles represent the standard deviations of the measured displacement among P1–P4.

