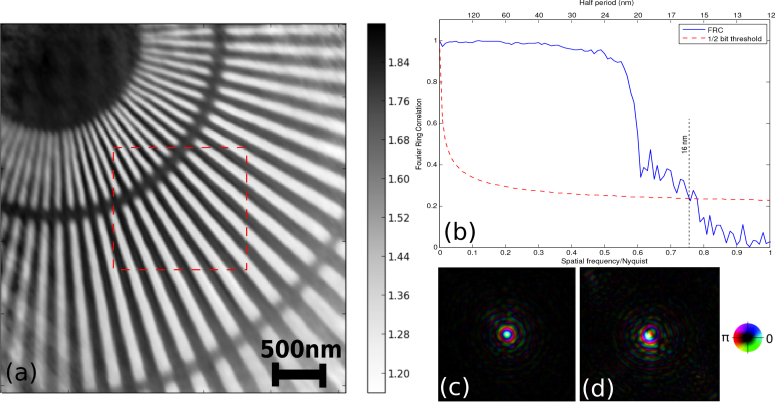
Fig. 7.
(a) Phase image of the reconstructed object transmission function, with the 1 μm×1 μm scan region highlighted in red. (b) Fourier ring correlation (FRC) plot showing a spatial resolution of 16 nm in the phase of the exit surface wave. (c,d) The recovered illumination function of two probe modes.

