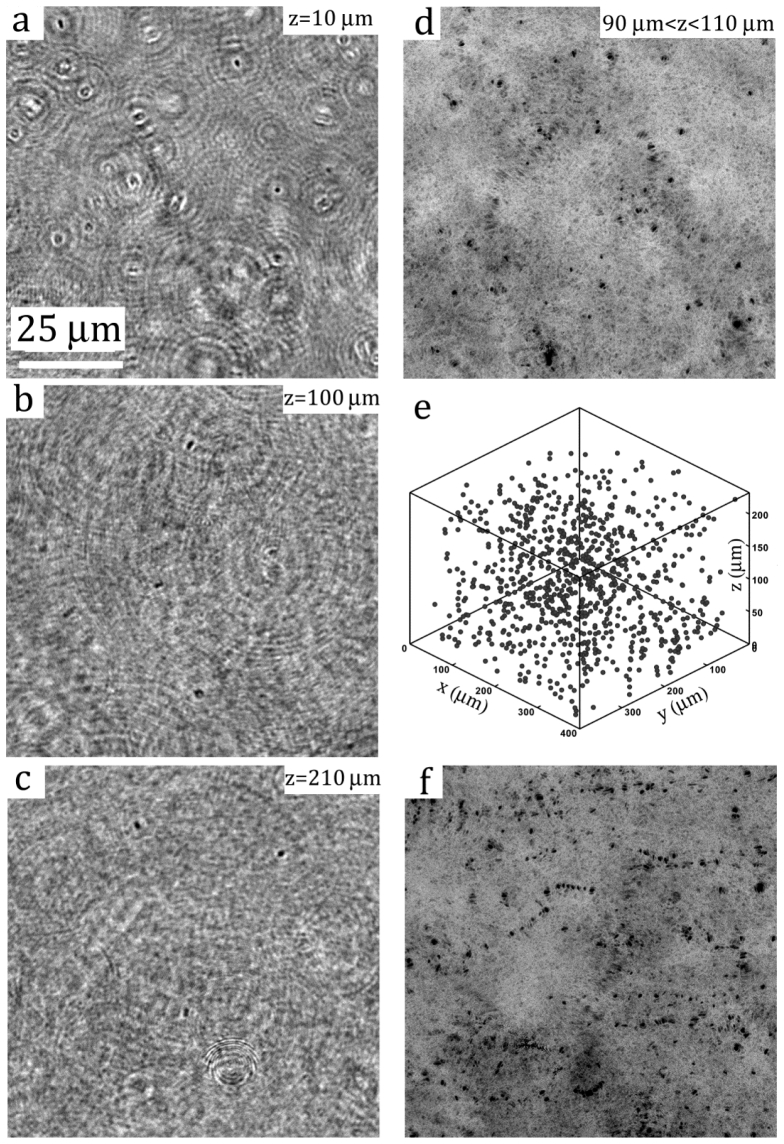
Fig. 4.
Reconstructions of bacterial hologram shown in Fig. 2(c). (a-c) reconstructed images at 10, 100, and 210μm away from the hologram plane. (d) Superimposed reconstructions at the interval of 0.5μm of the sample volume from 90μm to 110μm away from the hologram plane. (e) 3D distribution of particles. (f) Superimposed images reconstructed at the depth varying from 10μm to 15μm at the interval of 0.5μm over 0.33s, totaling 5 time frames.

