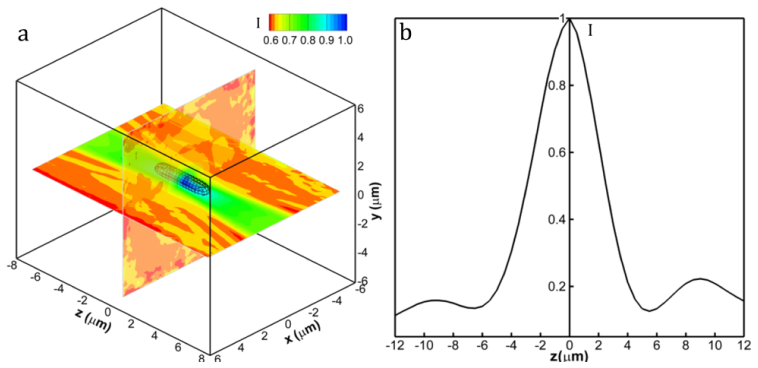
Fig. 6.

Intensity distribution of an ensemble averaged E. coli reconstruction. (a) Normalized 3D Intensity distribution of the ensemble averaged cell. Black lines show the iso-surface of intensity distribution threshold at 0.8. Two intersecting planes are x-y and x-z contour plots respectively. (b) The one-dimensional intensity distribution along the z axis. The width of the profile indicates the depth of focus of bacterial DHM.
