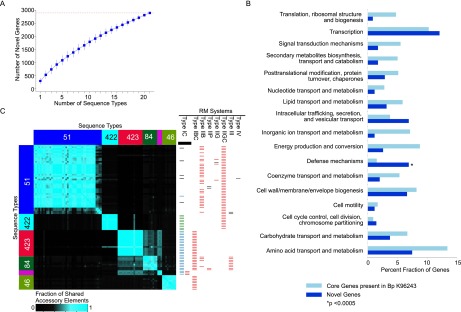
Figure 3.

Accessory genome landscape of Bp. (A) Accumulation curves for Bp novel accessory genes (blue). Vertical bars represent standard deviation values based upon 100 randomized input orders of different Bp STs. The total number of accessory genes is indicated by the red dotted line. (B) Functional enrichment of Bp accessory genes. COG functional categories are indicated on the y-axis, and the percentage of genes in each COG category is shown on the x-axis. Dark blue columns represent novel accessory genes, and light blue columns indicate all Bp core genes with COG annotations. COG categories exhibiting a significant enrichment among the Bp accessory genes are highlighted by asterisks ([*] P < 0.0005, binomial test; after Bonferroni correction). The COG category “DNA replication, recombination and repair” was excluded as it was represented mainly by mobility genes, particularly transposases and integrases. (C) Distribution of accessory elements across Bp clades. The heatmap represents an all-pairwise strain comparison showing the degree of accessory element overlap between pairs of strains. Strains are arranged on the x- and y-axis according to their genomic clades and sequence types (ST51 [blue]; ST289 [pink]; ST422 [cyan]; ST423 [red]; ST84 [dark green]; and ST46 [light green]). The color scale bar at the bottom indicates the degree of accessory element sharing (more blue equates to increased sharing). The right-hand chart depicts the different types of restriction-modification (RM) systems associated with different clades. In each column, the RM systems are color-coded based on their encoded protein-coding sequences. In the first column, the bars in green and blue refer to two distinct sets of RM genes that belong to Type IC RM systems. Strain-specific RM systems are in black.
