Figure 6.
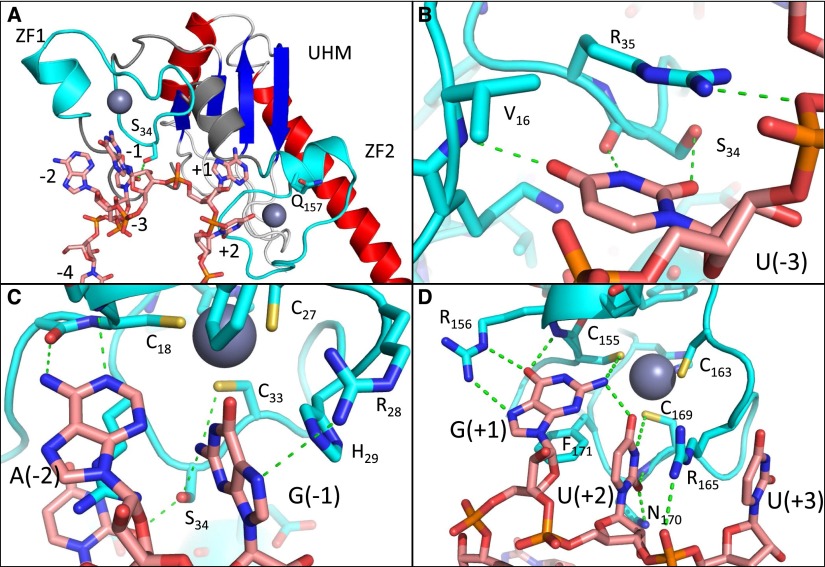
Theoretical model of the U2AF1:RNA complex. (A) Overview, with the zinc finger domains colored cyan, the RNA in salmon, the UHM beta sheet in blue, and alpha helices in red. The frequently mutated positions S34 and Q157 are shown in stick representation. (ZF) Zinc finger. (B–D) Interactions with individual bases characteristic of the 3′ splice site consensus. Green dotted lines indicate hydrogen bonds and favorable electrostatic interactions; RNA and selected side chains are shown in stick representation.

