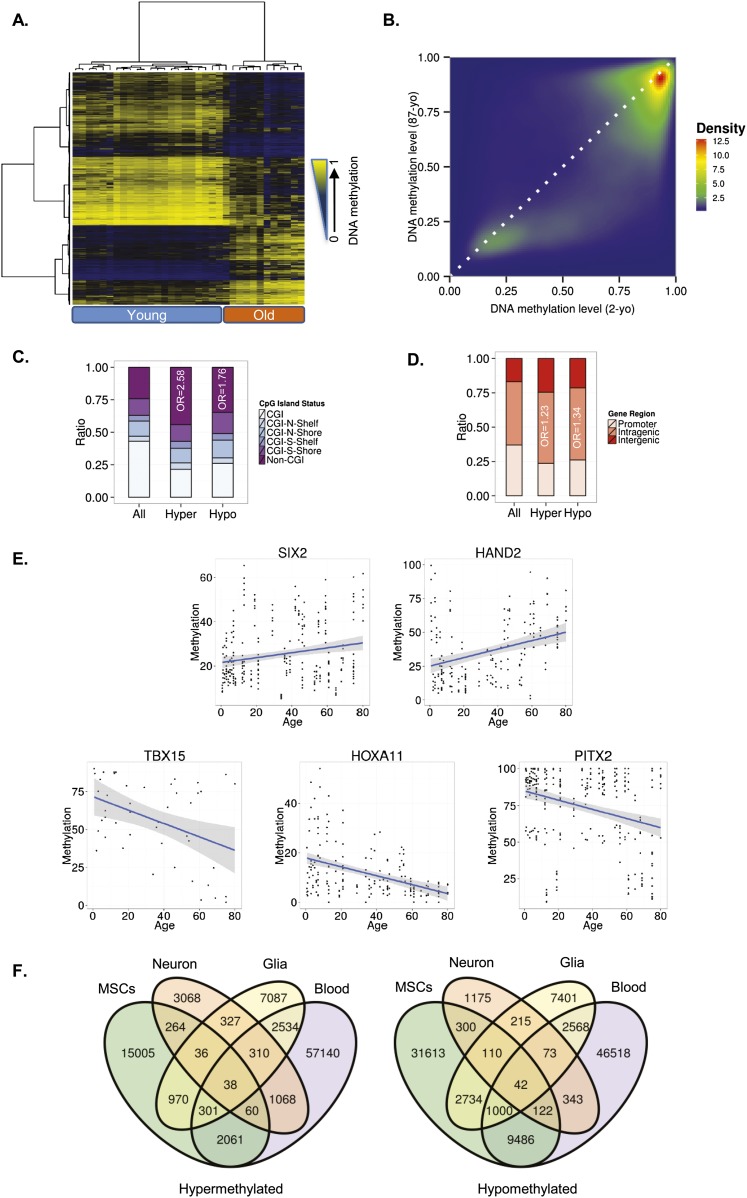
Figure 1.
DNA methylation changes during MSC aging. (A) Unsupervised hierarchical clustering and heatmap including the 15,000 most variable CpG sites with differential DNA methylation between young and old MSCs. Average methylation values are displayed from zero (blue) to one (yellow). (B) Density plot for differentially methylated CpG sites between representative young (2-yr-old [2-yo]) and old (87-yr-old [87-yo]) MSCs. (C) Distribution of differentially methylated CpGs relative to the CpG island. (D) Relative distribution of differentially methylated CpGs across different genomic regions. (E) Examples of aging-specific CpG methylation, in particular, genes further validated by pyrosequencing in an independent set of samples. For each of the genes of interest, a scatter plot of the percentage of methylation obtained for each sample and CpG of interest is shown. The two genes at the top show an age-dependent hypermethylation tendency, while the three genes at the bottom show hypomethylation with respect to age. Each point represents a single observation for a given sample and CpG of interest. The blue line represents a linear model fit. A 0.95 confidence interval of the fitted model is shown in gray. (F) Venn diagrams showing the number of CpG sites (hyper- and hypomethylated) shared by the different tissues

