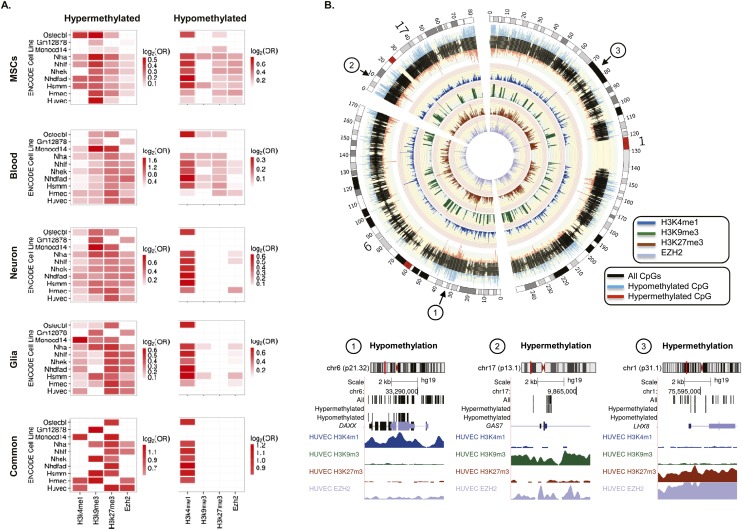
Figure 2.
Chromatin signatures associated with DNA methylation changes during aging. (A) Heatmaps showing significant enrichment of hyper- and hypomethylated CpG sites—identified in MSCs, blood, neurons, and glia—with different histone marks and chromatin modifiers contained in the UCSC Genome Browser Broad histone track from the ENCODE Project. Color code indicates the significant enrichment based on log2 odds ratio (OR). (B) Circular representation of three representative chromosomes (1, 6, and 17), indicating whether the CpGs were hypermethylated (red) or hypomethylated (blue) during MSC aging. Inner tracks display chromatin marks (H3K4me1, H3K9me3, H3K27me3, and EZH2) generated for HUVEC cells and associated with differentially methylated regions during aging. Broad histone peak information was averaged in 200-kbp genomic windows and represented as histogram tracks. Three examples of hypo- and hypermethylated DNA regions associated with specific chromatin signatures are displayed below.

