
Figure 5.
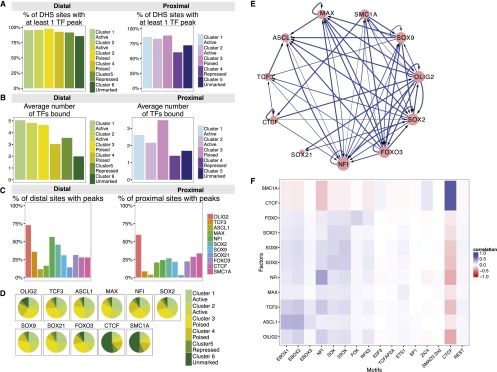
TFs whose motifs are enriched in distal enhancers show distinct patterns of CRE-binding. (A) Percentage of DHSs belonging to each cluster that contains a significant ChIP-seq binding peak for one or more of the 11 TFs studied here. (B) The mean number of different TFs bound to each class of DHS elements. (C) Percentage of distal and proximal DHSs that are bound by each TF. (D) Distribution of each factor's binding peaks within the different classes of distal DHSs. The majority of TF binding peaks are found in the more active (cluster 1 to 3) regions for all factors, apart from CTCF and SMC1A, which more frequently bind unmarked distal regions. (E) Network graph showing the predicted regulatory interactions between the key TFs analyzed in this study. Each arrow represents promoter-proximal binding from our ChIP-seq data. (F) Pairwise matrix showing the Pearson correlation coefficients between TF peaks (y-axis) and motifs (x-axis) within each distal DHSs.