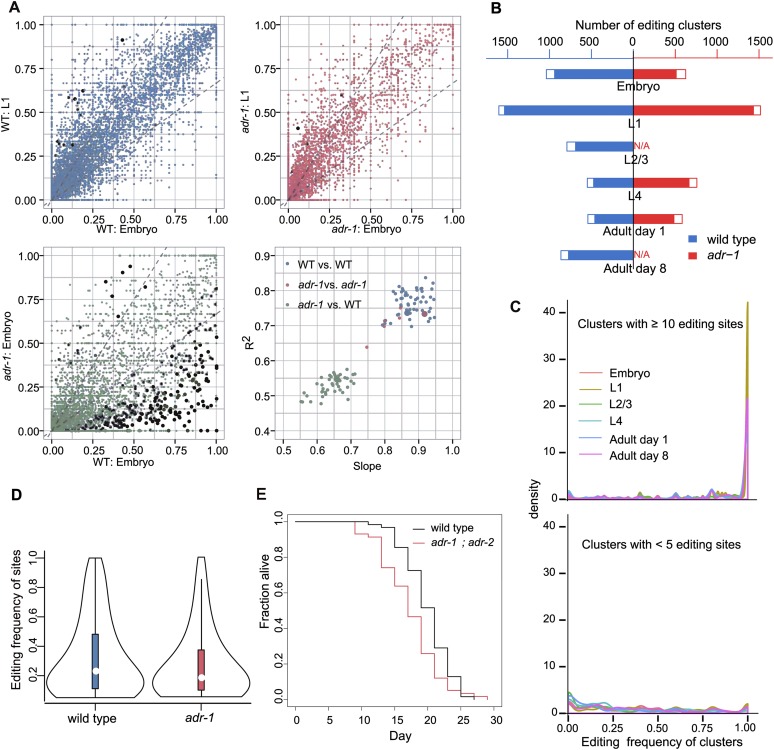
Figure 3.
Characteristics of RNA editing in ADAR mutant strains compared with the wild type. (A) Pairwise comparison of RNA editing frequency at each site between samples. Three scatter plots illustrate the comparison of RNA editing site frequency between three pairs of samples. (Blue) Wild-type vs. wild-type; (red) adr-1 vs. adr-1; (green) wild-type vs. adr-1. Black dots highlight sites with significant differences in editing frequency between samples (Fisher’s exact test, corrected P < 0.01). Linear regression was performed for each pair of samples, and the slope and R2 were plotted in the lower right panel. (B) Number of editing clusters in each sample. Filled bars depict the number of editing clusters. Empty bars depict the number of expressed clusters not edited in this sample but edited in at least one other sample. (C) Density plot of the number of RNA editing clusters over editing frequency at different developmental stages. For clusters with 10 or more editing sites, there was generally a peak near 100% of editing frequency. For clusters with less than five editing sites, the density curves were generally flat with a rise near zero. Lines of different colors indicate different developmental stages. (D) Violin plot of the distribution of RNA editing frequency in the wild type and the adr-1 mutant. The adr-1 mutant had reduced RNA editing frequency. (E) adr-1; adr-2 mutant worms have a shortened lifespan at 20°C (log-rank test, P = 0.004).

